DevSecOps : Reactapp CI - CD pipeline with Grafana


HLD
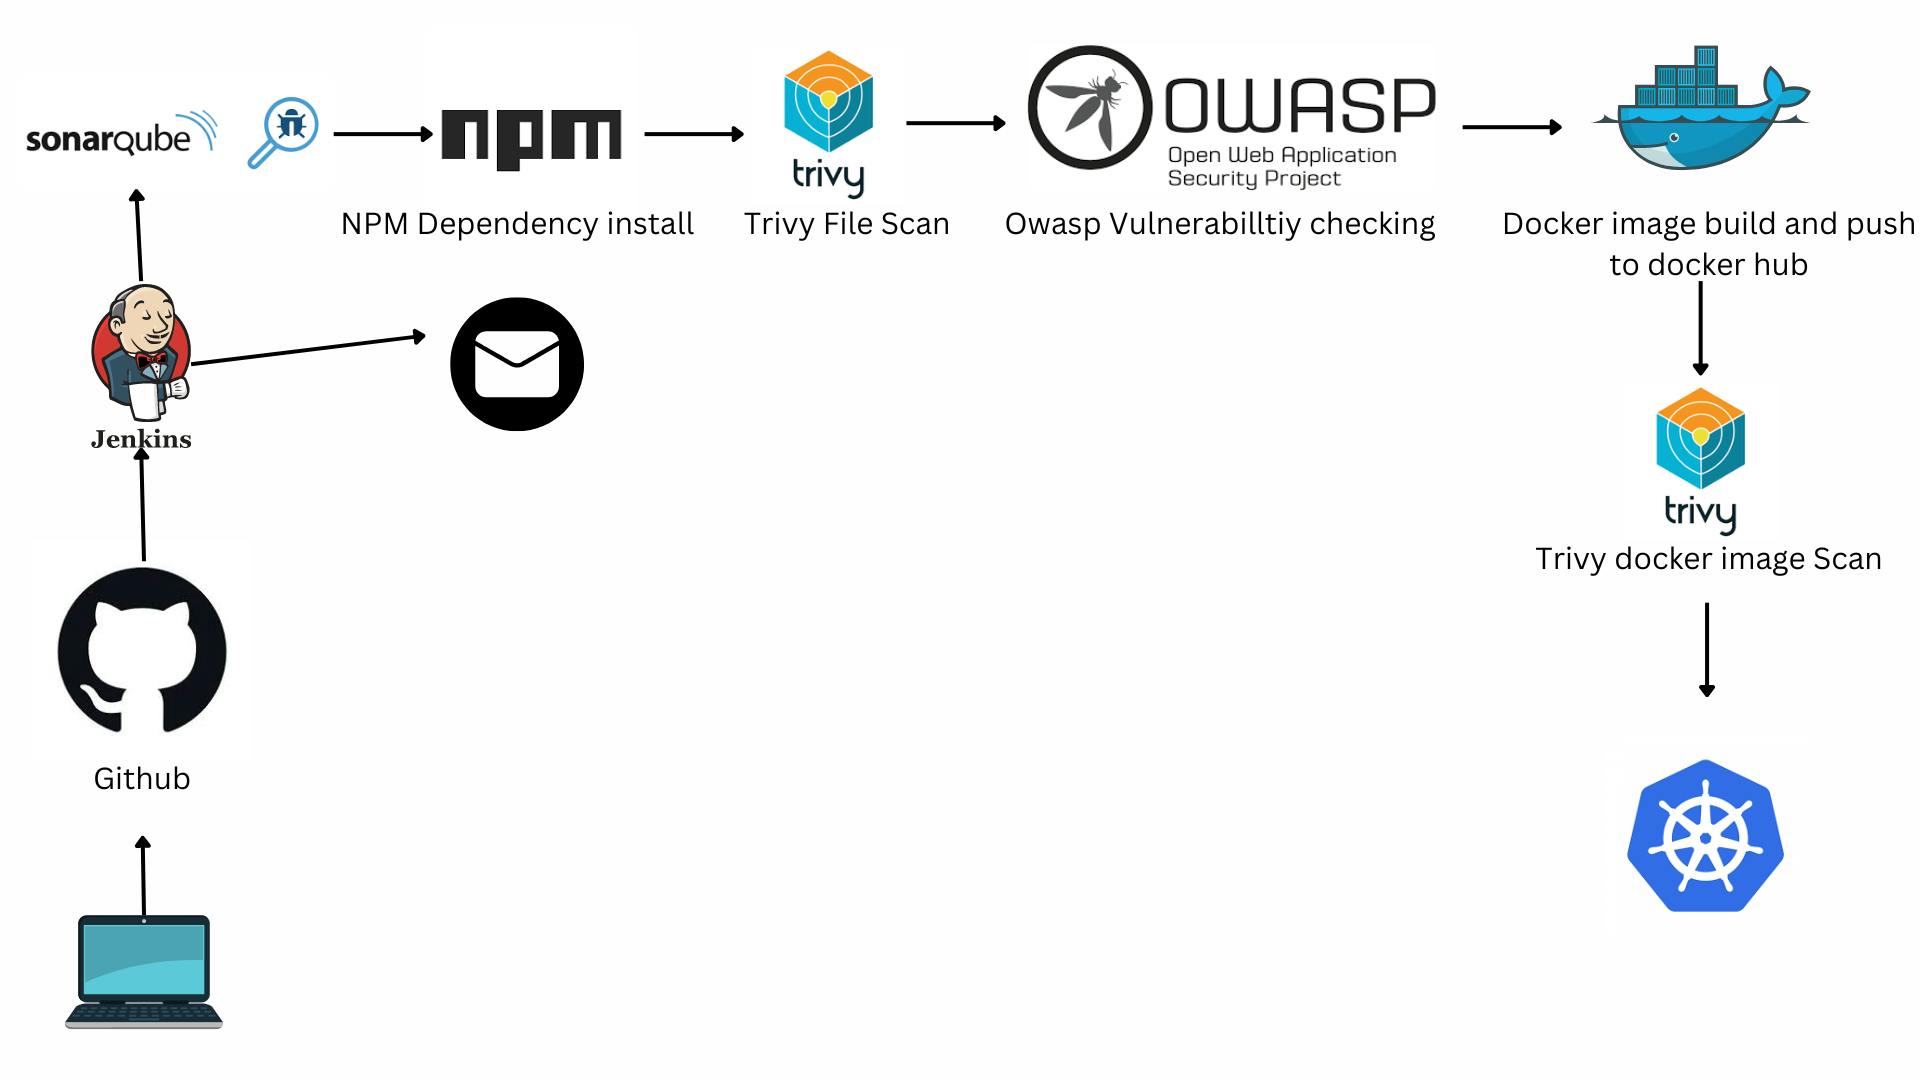
Steps for Deploying netflix clone
Step1 : Setting up Jenkins Server
Launch an AWS T2 Large Instance. Use the image as Ubuntu. You can create a new key pair or use an existing one. Enable HTTP and HTTPS settings in the Security Group and open all ports (not best case to open all ports but just for learning purposes it's okay).
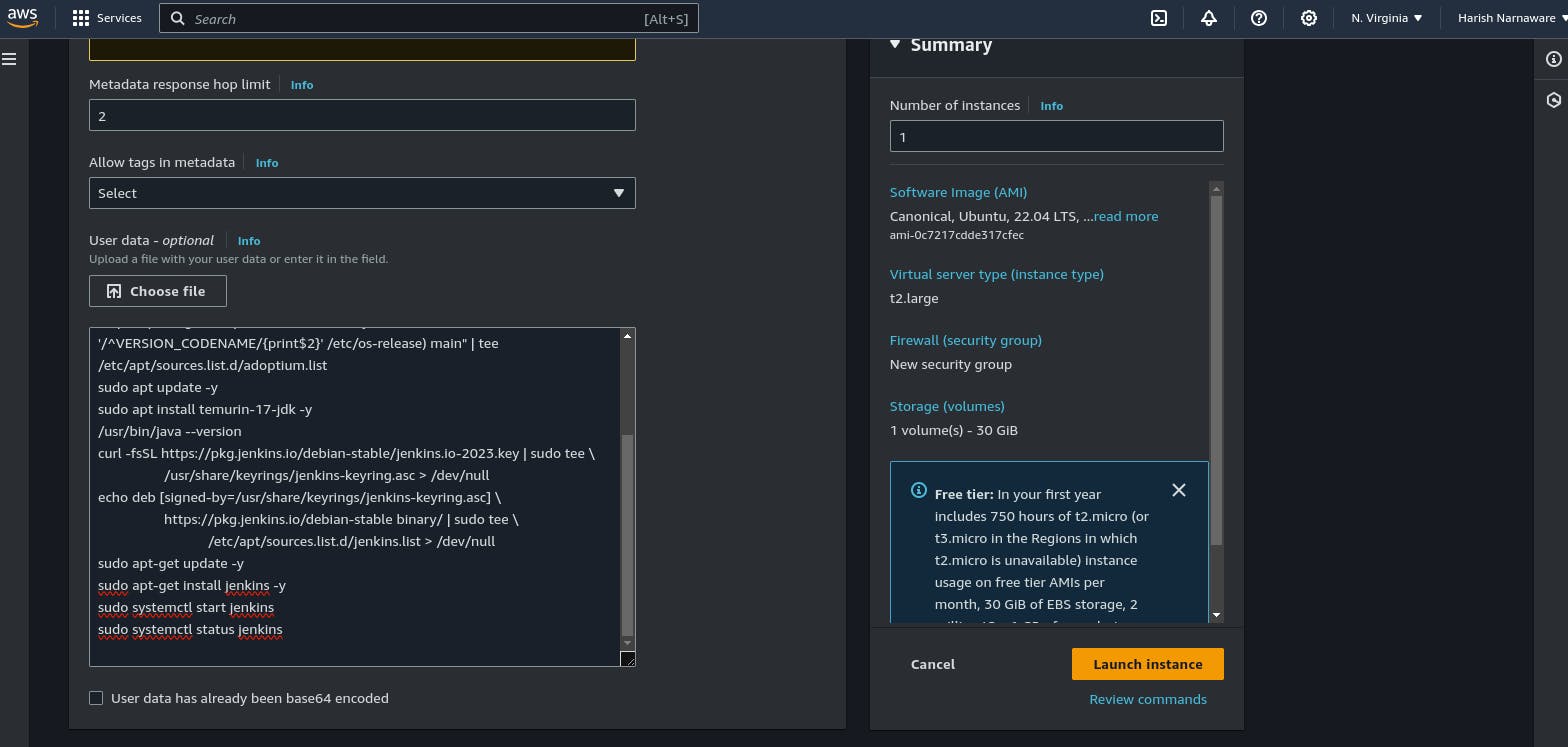
put this script in box
#!/bin/bash
sudo apt update -y
#sudo apt upgrade -y
wget -O - https://packages.adoptium.net/artifactory/api/gpg/key/public | tee /etc/apt/keyrings/adoptium.asc
echo "deb [signed-by=/etc/apt/keyrings/adoptium.asc] https://packages.adoptium.net/artifactory/deb $(awk -F= '/^VERSION_CODENAME/{print$2}' /etc/os-release) main" | tee /etc/apt/sources.list.d/adoptium.list
sudo apt update -y
sudo apt install temurin-17-jdk -y
/usr/bin/java --version
curl -fsSL https://pkg.jenkins.io/debian-stable/jenkins.io-2023.key | sudo tee \
                  /usr/share/keyrings/jenkins-keyring.asc > /dev/null
echo deb [signed-by=/usr/share/keyrings/jenkins-keyring.asc] \
                  https://pkg.jenkins.io/debian-stable binary/ | sudo tee \
                              /etc/apt/sources.list.d/jenkins.list > /dev/null
sudo apt-get update -y
sudo apt-get install jenkins -y
sudo systemctl start jenkins
sudo systemctl status jenkins
Once Jenkins is installed, you will need to go to your AWS EC2 Security Group and open Inbound Port 8080, since Jenkins works on Port 8080.
Unlock your jenkins with intital admin password
sudo cat /var/lib/jenkins/secrets/initialAdminPassword
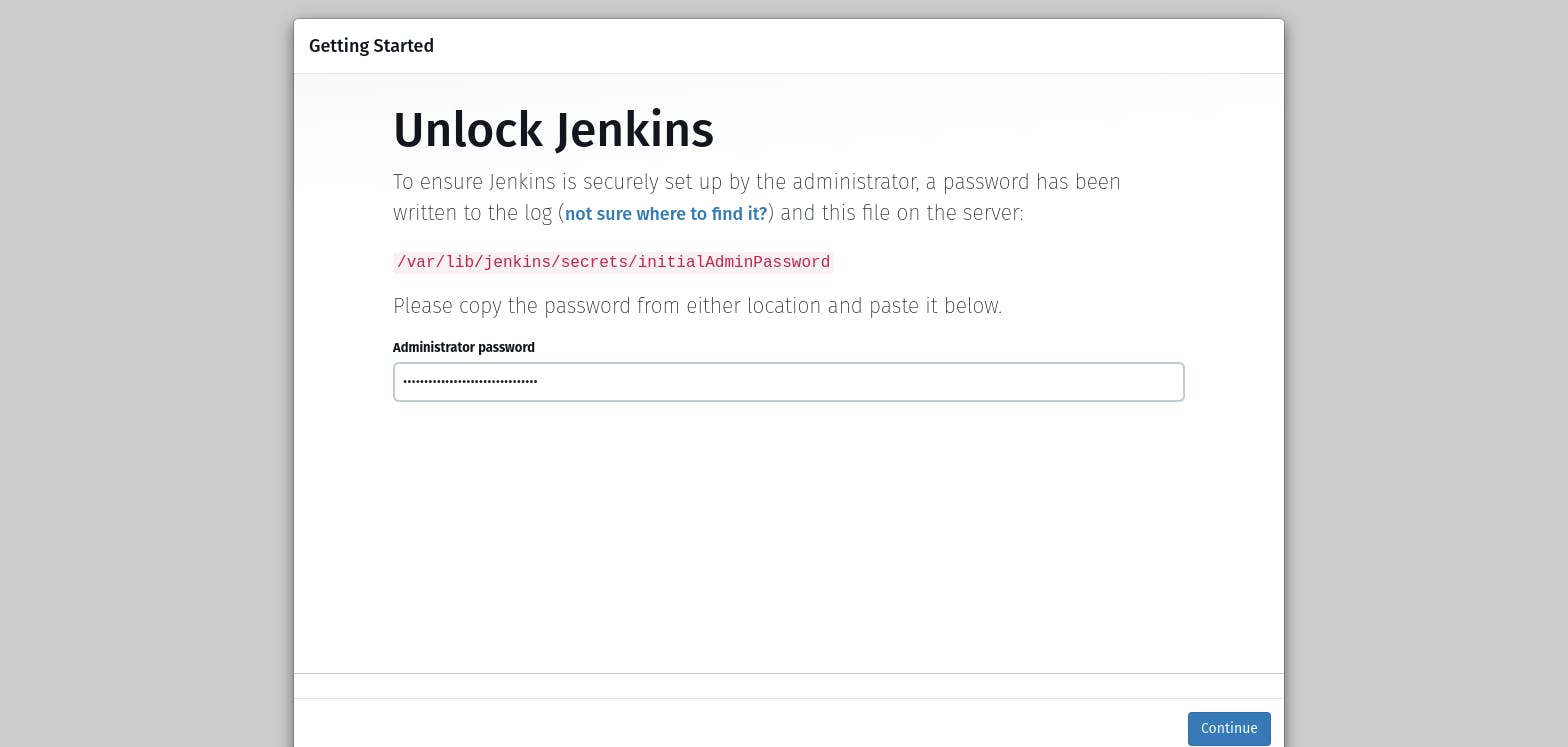
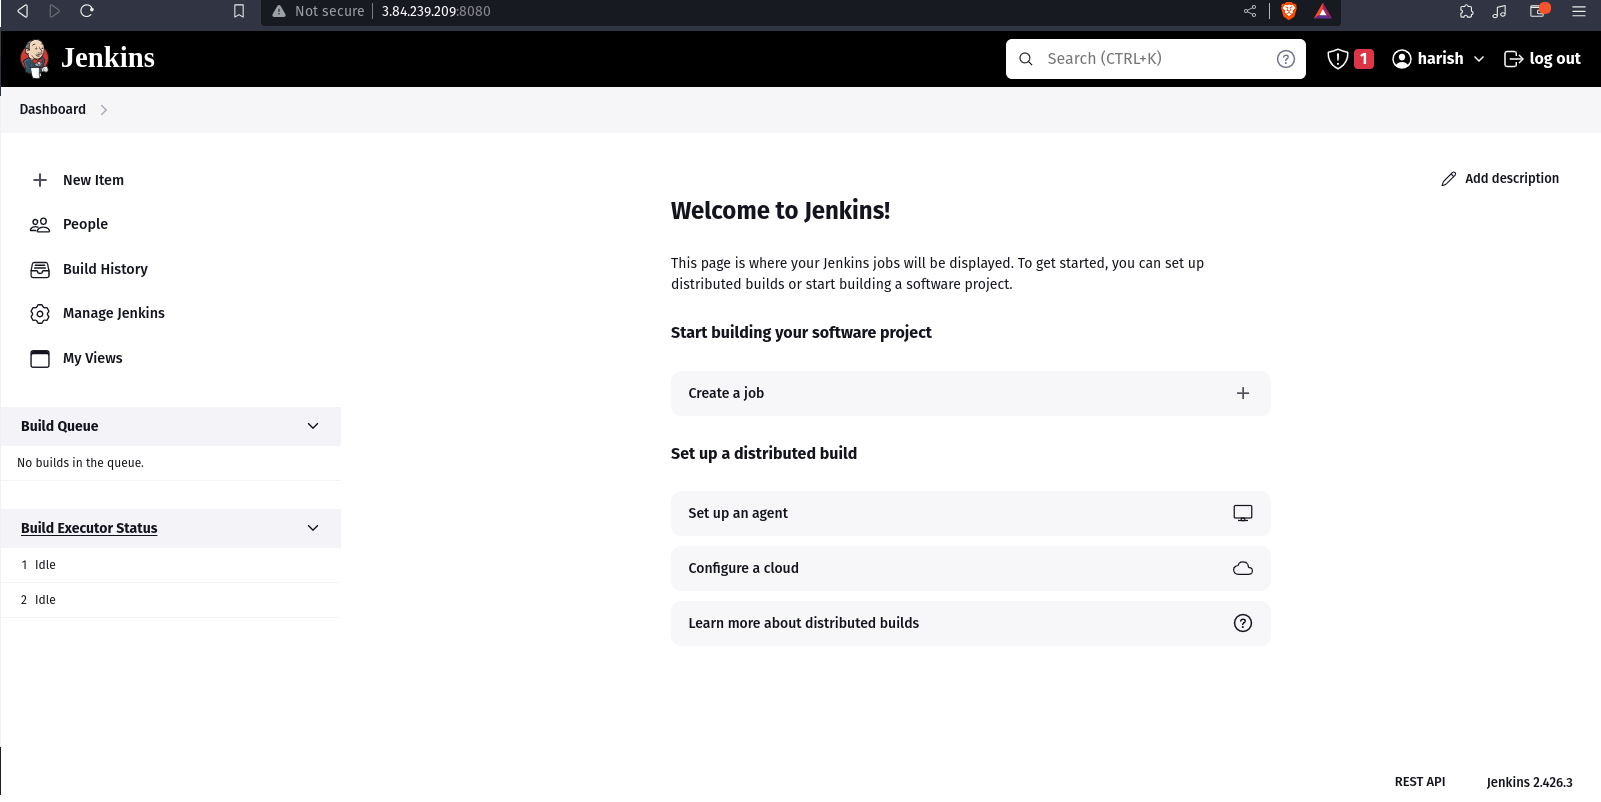
you got Jenkins home
Docker Installation in Jenkins Server
sudo apt-get update
sudo apt-get install docker.io -y
sudo usermod -aG docker $USER   #my case is ubuntu
newgrp docker
sudo chmod 777 /var/run/docker.sock
After the docker installation, we create a sonarqube container (Remember to add 9000 ports in the security group).
docker run -d --name sonar -p 9000:9000 sonarqube:lts-community
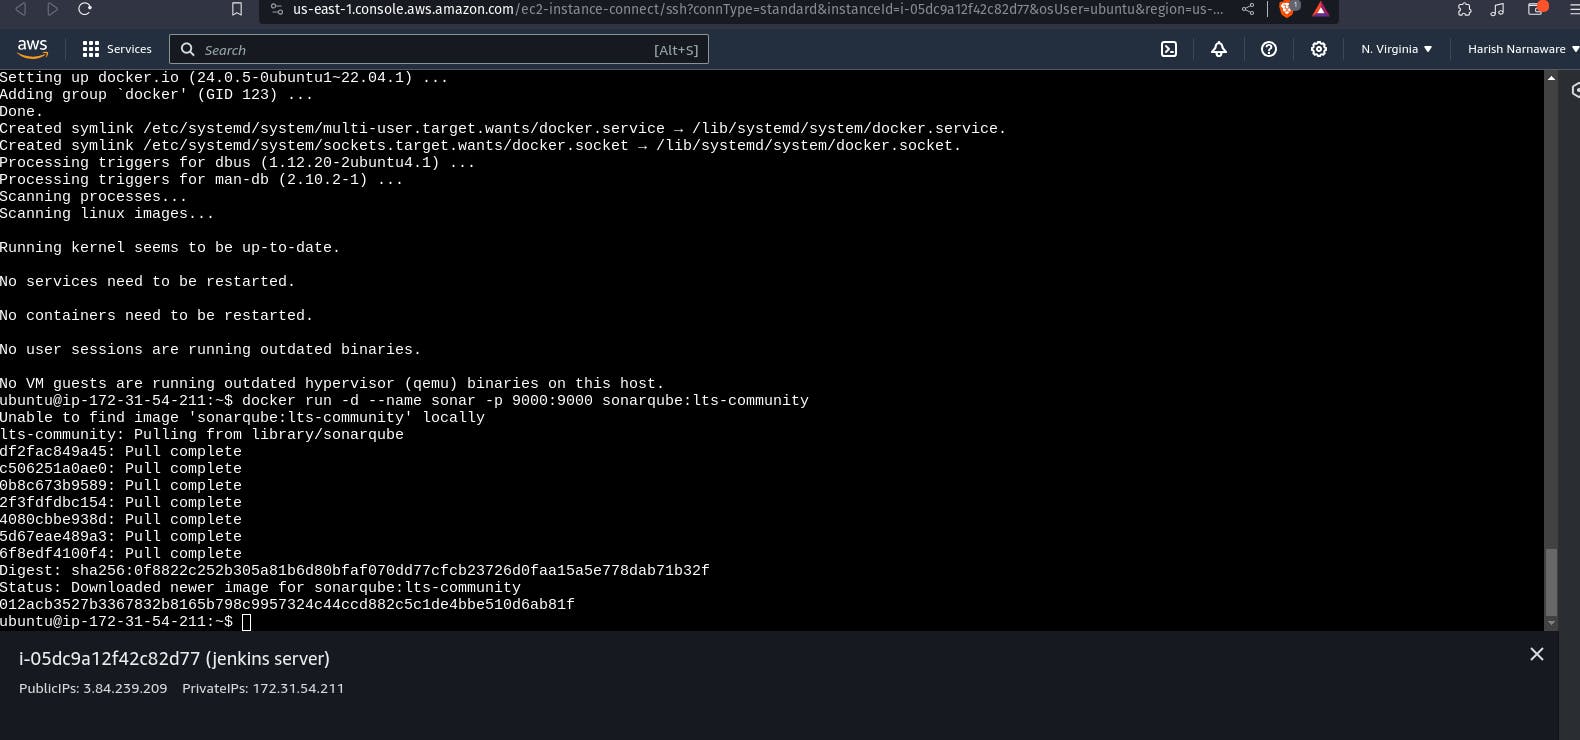
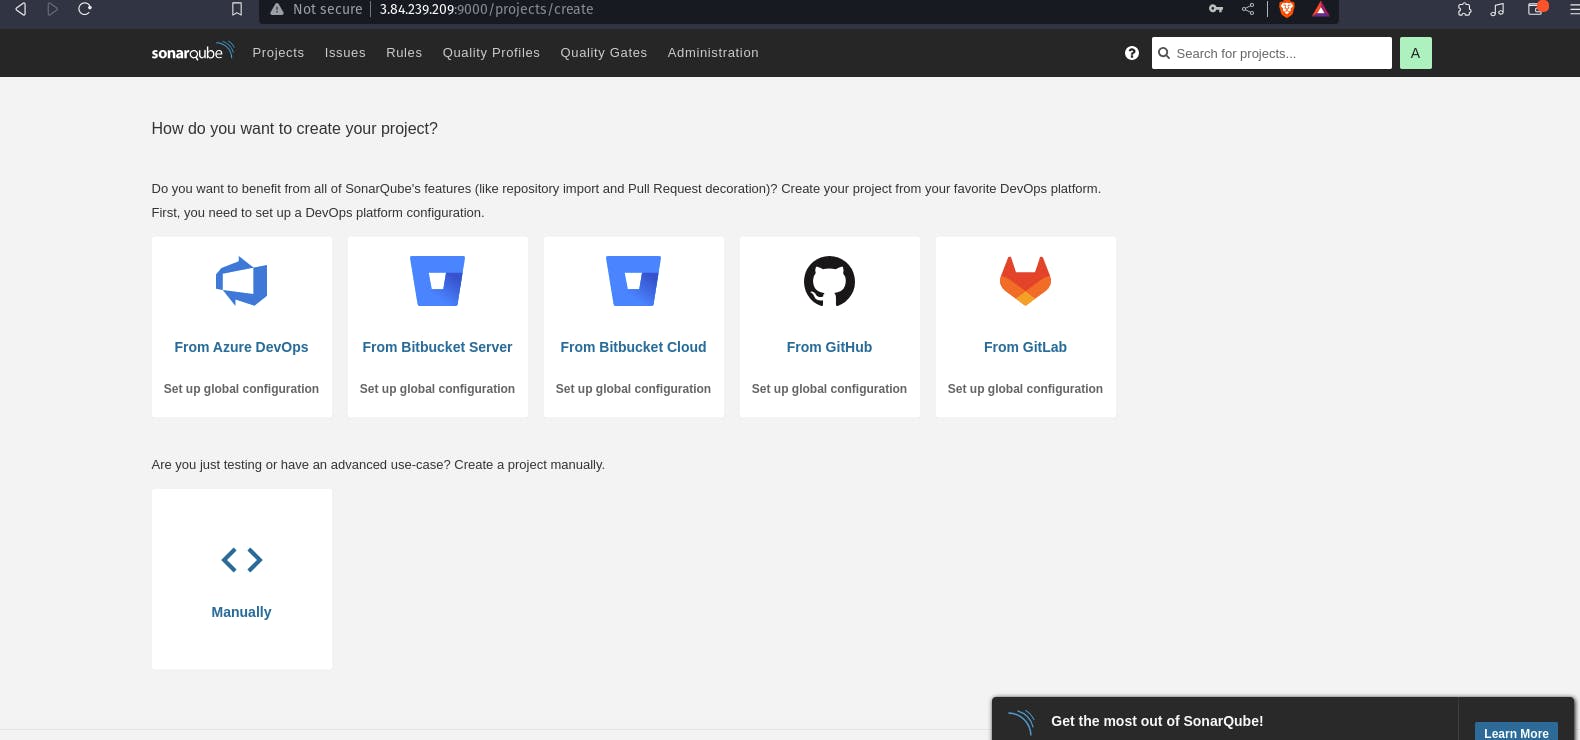
check port 9000 you will see sonarqube is running.
Step2 : Setting up Prometheus Server
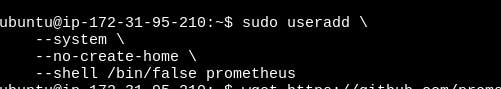
lets create first prometheus user
sudo useradd \
    --system \
    --no-create-home \
    --shell /bin/false prometheus
--system - Will create a system account.
--no-create-home - We don't need a home directory for Prometheus or any other system accounts in our case.
--shell /bin/false - It prevents logging in as a Prometheus user.
Prometheus - Will create a Prometheus user and a group with the same name.
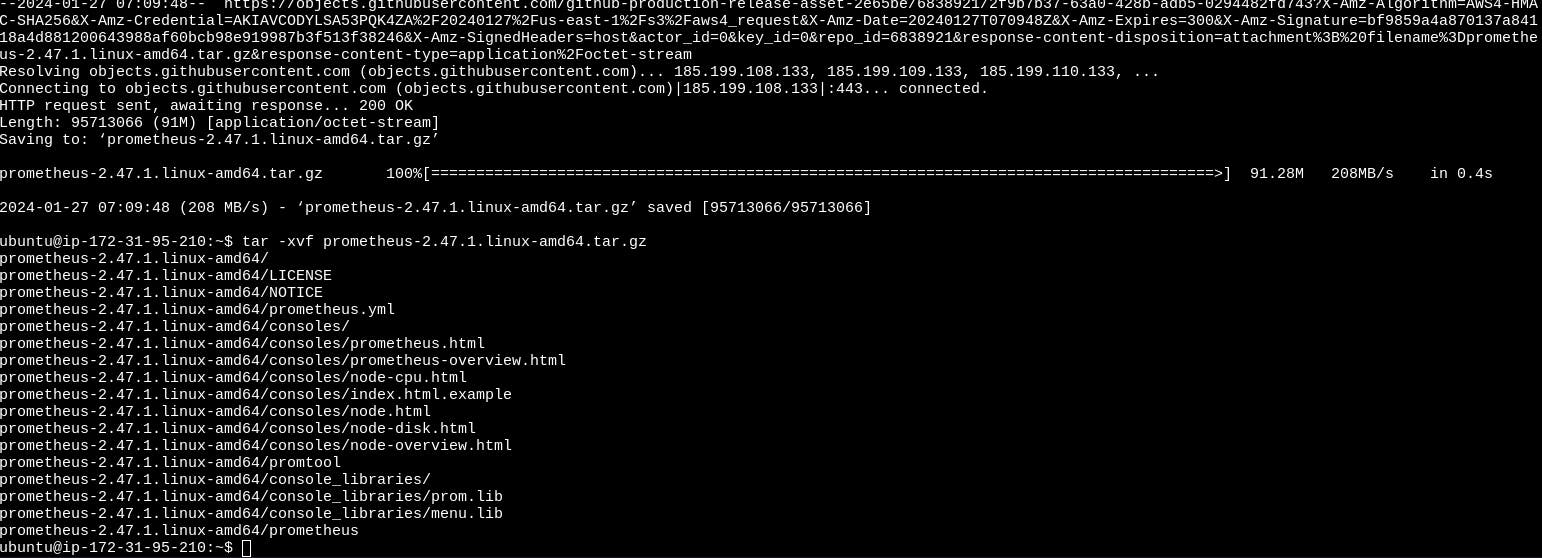
You can use the curl or wget command to download Prometheus.
wget https://github.com/prometheus/prometheus/releases/download/v2.47.1/prometheus-2.47.1.linux-amd64.tar.gz
Then, we need to extract all Prometheus files from the archive.
tar -xvf prometheus-2.47.1.linux-amd64.tar.gz
Usually, you would have a disk mounted to the data directory. For this tutorial, I will simply create a /data directory. Also, you need a folder for Prometheus configuration files.
sudo mkdir -p /data /etc/prometheus

First of all, let's move the Prometheus binary and a promtool to the /usr/local/bin/. promtool is used to check configuration files and Prometheus rules.
sudo mv prometheus promtool /usr/local/bin/
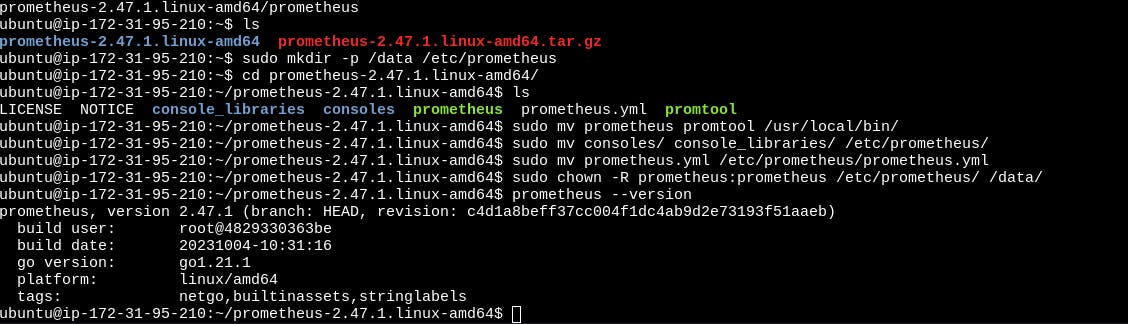
sudo mv consoles/ console_libraries/ /etc/prometheus/
Optionally, we can move console libraries to the Prometheus configuration directory. Console templates allow for the creation of arbitrary consoles using the Go templating language. You don't need to worry about it if you're just getting started.
sudo mv consoles/ console_libraries/ /etc/prometheus/
Finally, let's move the example of the main Prometheus configuration file.
sudo mv prometheus.yml /etc/prometheus/prometheus.yml
To avoid permission issues, you need to set the correct ownership for the /etc/prometheus/ and data directory.
sudo chown -R prometheus:prometheus /etc/prometheus/ /data/
Install Grafana on Ubuntu 22.04
To visualize metrics we can use Grafana. There are many different data sources that Grafana supports, one of them is Prometheus.
First, let's make sure that all the dependencies are installed.
sudo apt-get install -y apt-transport-https software-properties-common
add the GPG key.
wget -q -O - https://packages.grafana.com/gpg.key | sudo apt-key add -
Add this repository for stable releases.
echo "deb https://packages.grafana.com/oss/deb stable main" | sudo tee -a /etc/apt/sources.list.d/grafana.list
After you add the repository, update and install Garafana.
sudo apt-get update
sudo apt-get -y install grafana
To automatically start the Grafana after reboot, enable the service.
sudo systemctl enable grafana-server
To check the status of Grafana, run the following command:
sudo systemctl status grafana-server
Go to http://<ip>:3000 and log in to the Grafana using default credentials.
use username as admin and password as admin.

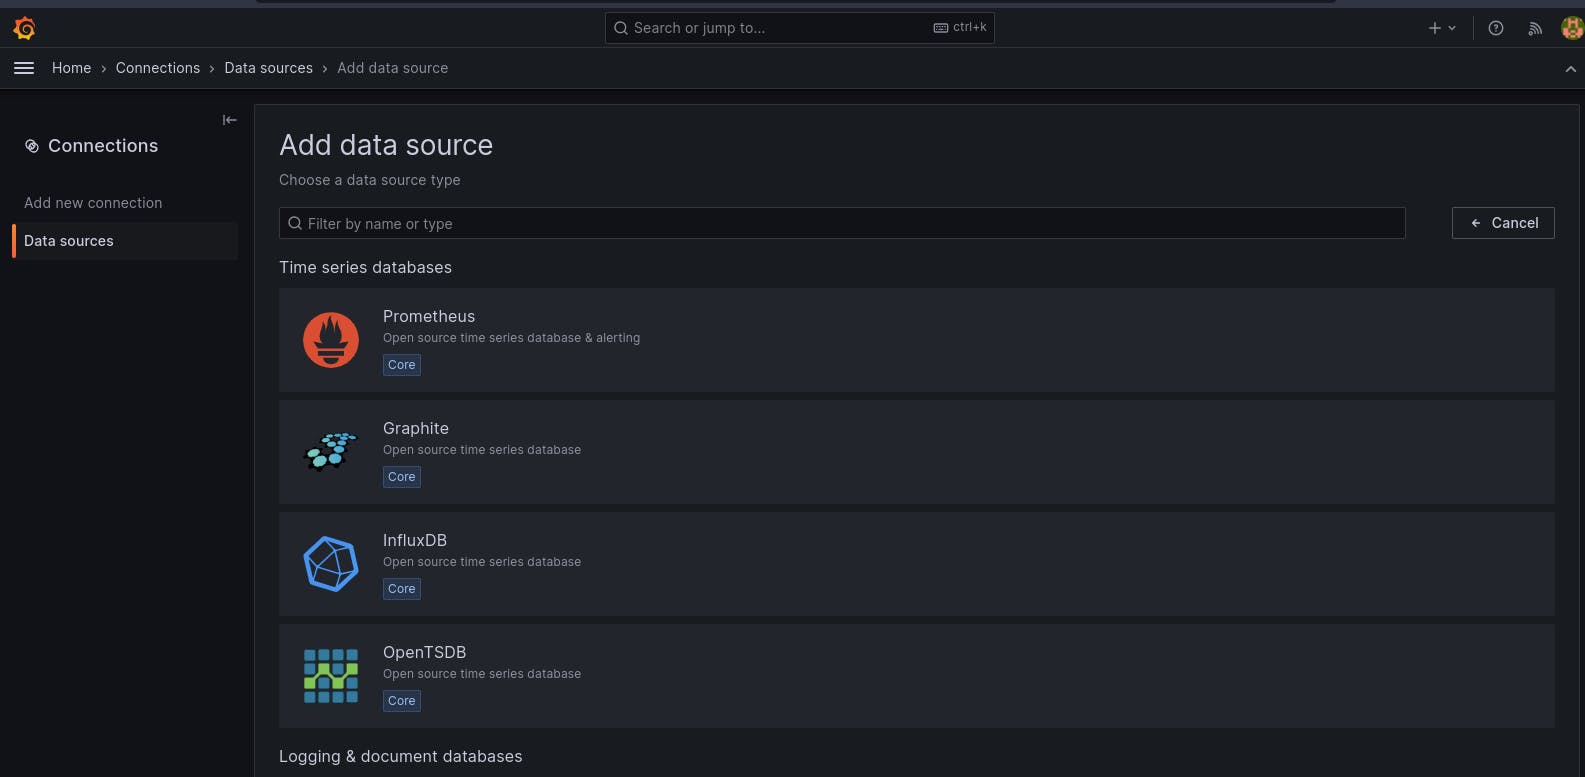
Click Add data source and select Prometheus.
For the URL, enter localhost:9090and click Save and test. You can see Data source is working.
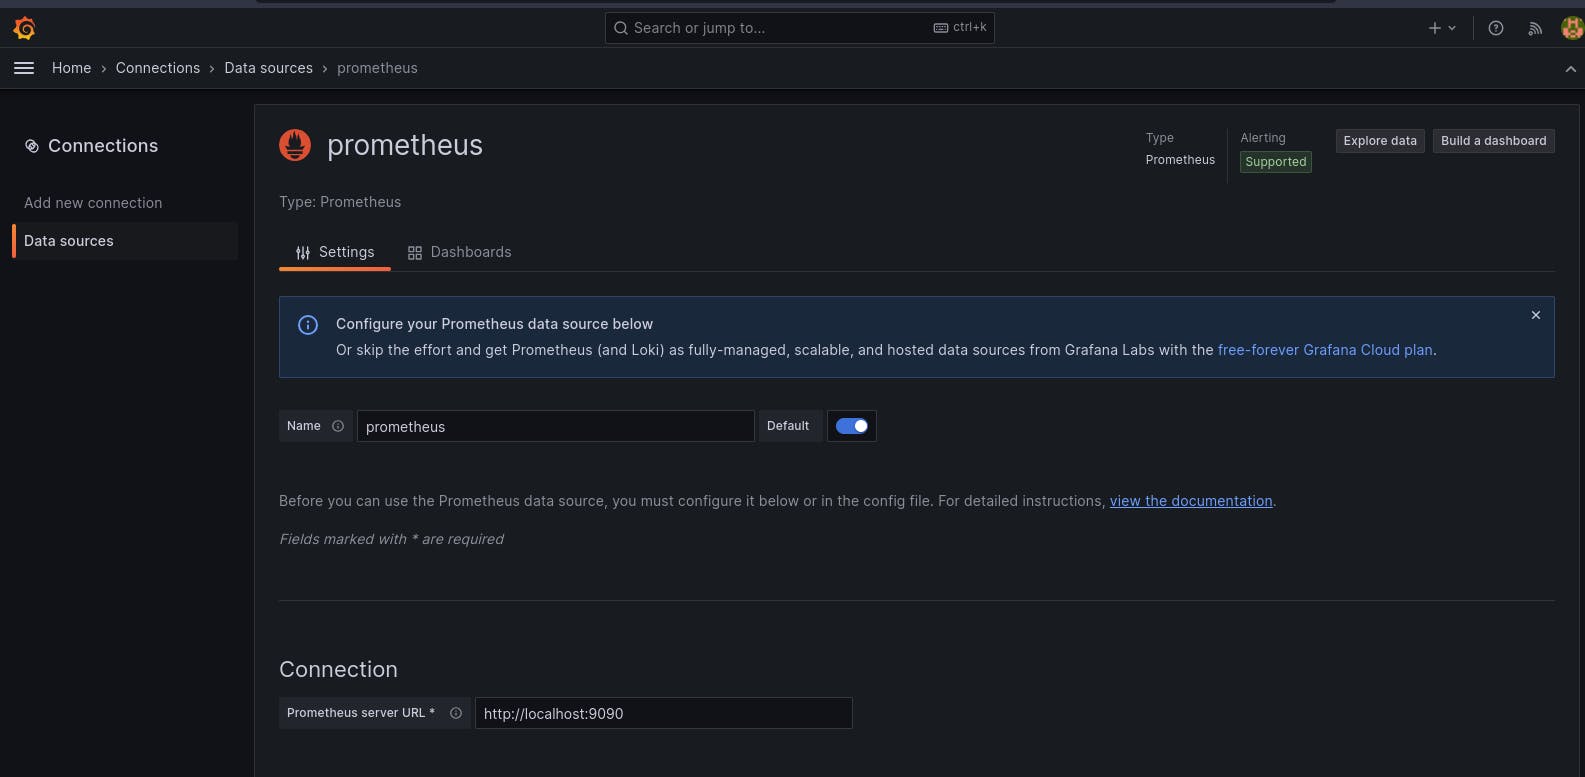
Click on Save and Test.
Let's add Dashboard for a better view
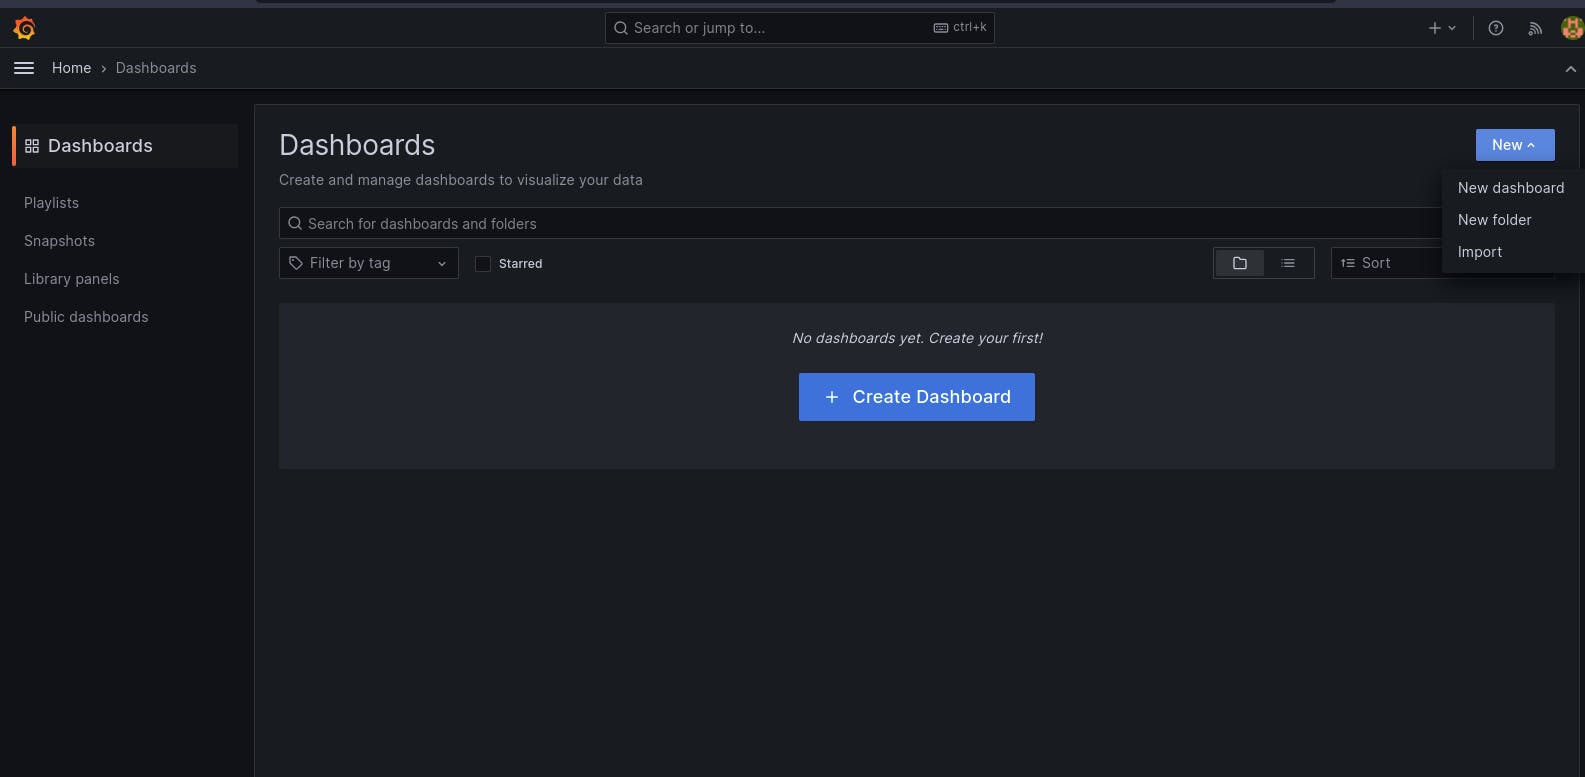
Click on Import Dashboard paste this code 1860 and click on load

Select the Datasource and click on Import
You will see this output

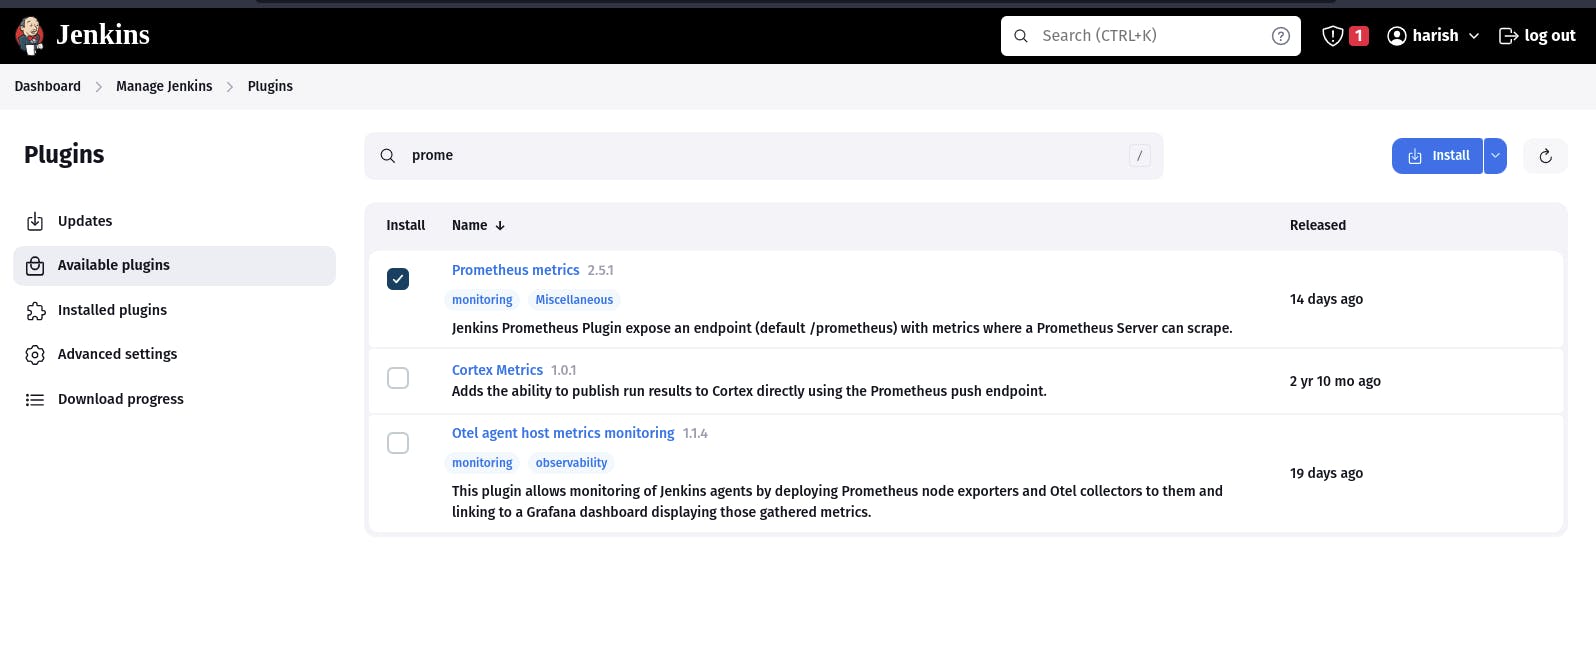
Step3: Install Prometheus Plugin in jenkins and Integrate it with the Prometheus Server.
Let's Monitor JENKINS SYSTEM
Goto Manage Jenkins --> Plugins --> Available Plugins
Once that is done you will Prometheus is set to /Prometheus path in system configurations
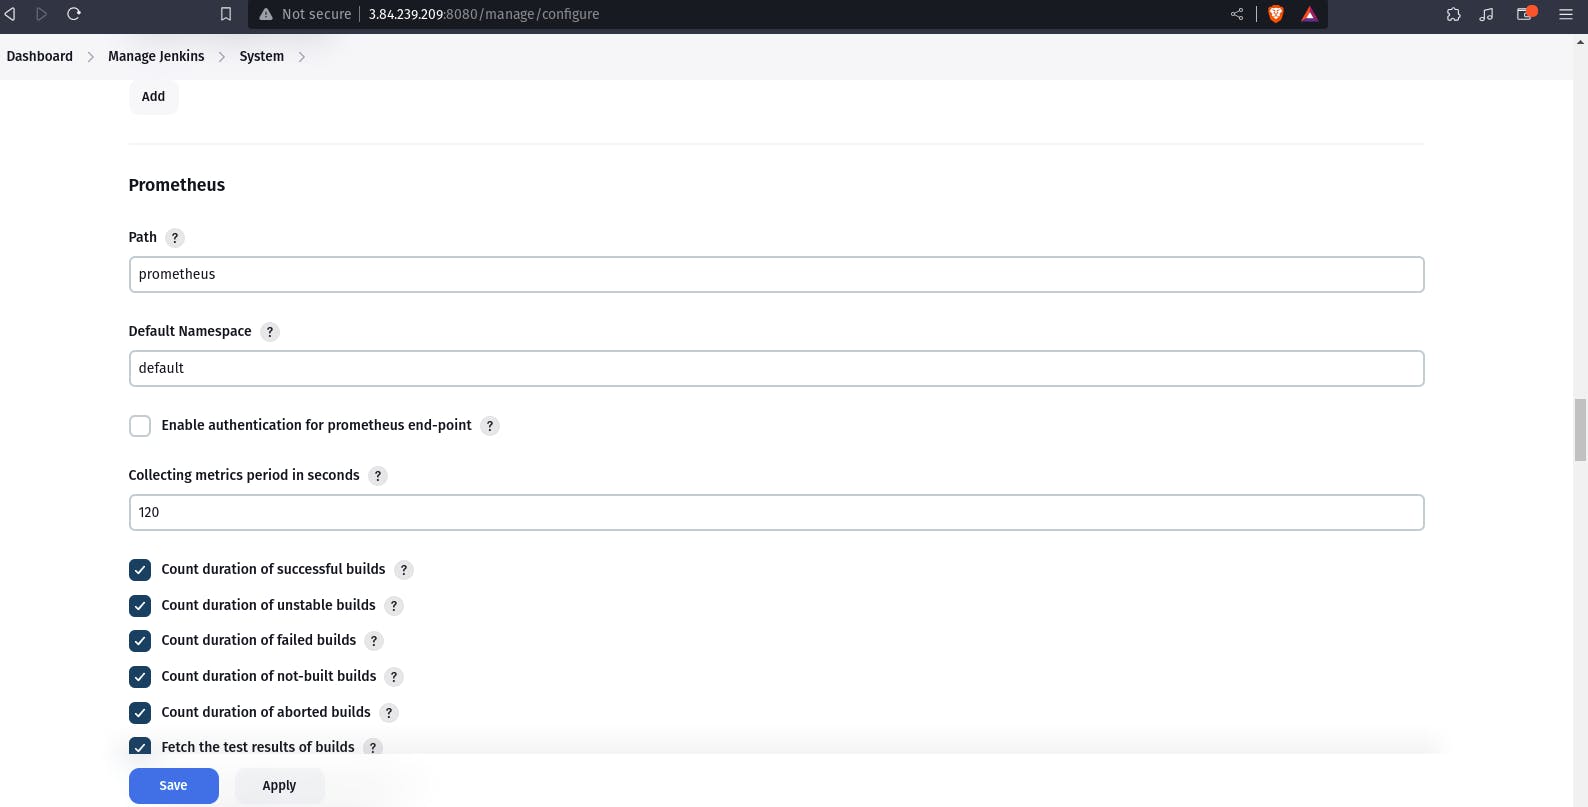
Nothing to change click on apply and save
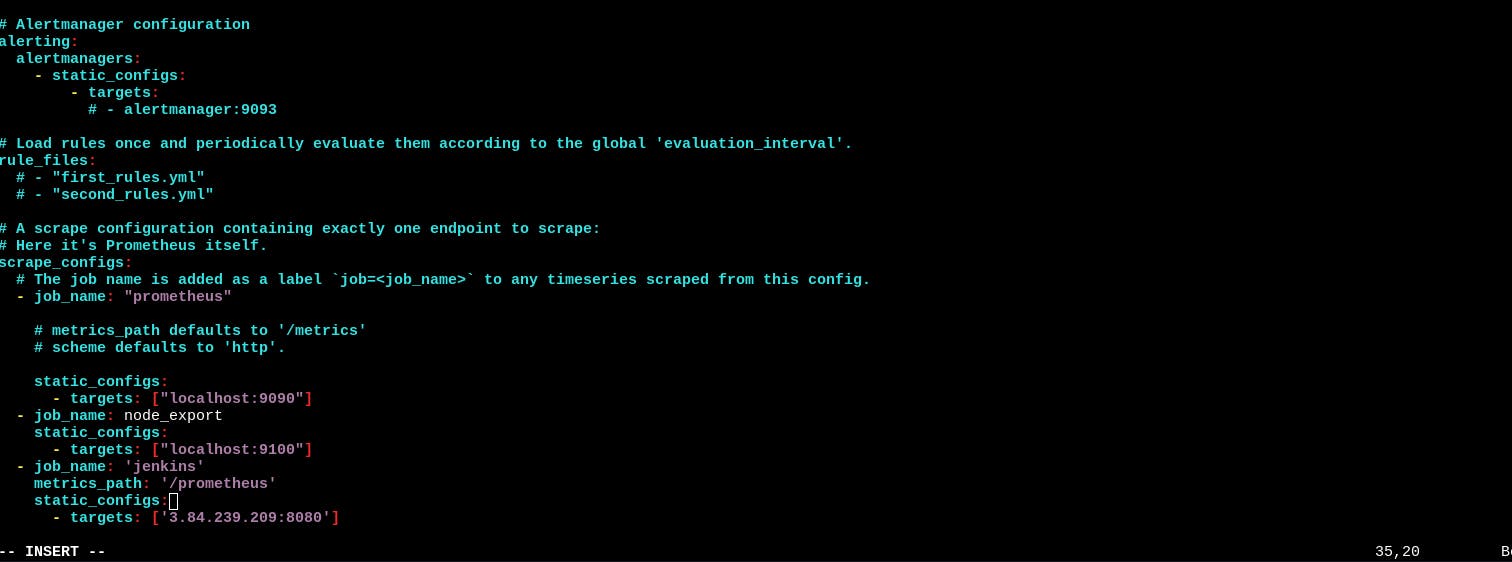
To create a static target, you need to add job_name with static_configs. go to Prometheus server.
sudo vim /etc/prometheus/prometheus.yml
Paste below code
  - job_name: 'jenkins'
    metrics_path: '/prometheus'
    static_configs:
      - targets: ['<jenkins-ip>:8080']
Before, restarting check if the config is valid.
promtool check config /etc/prometheus/prometheus.yml
Then, you can use a POST request to reload the config.
curl -X POST http://localhost:9090/-/reload
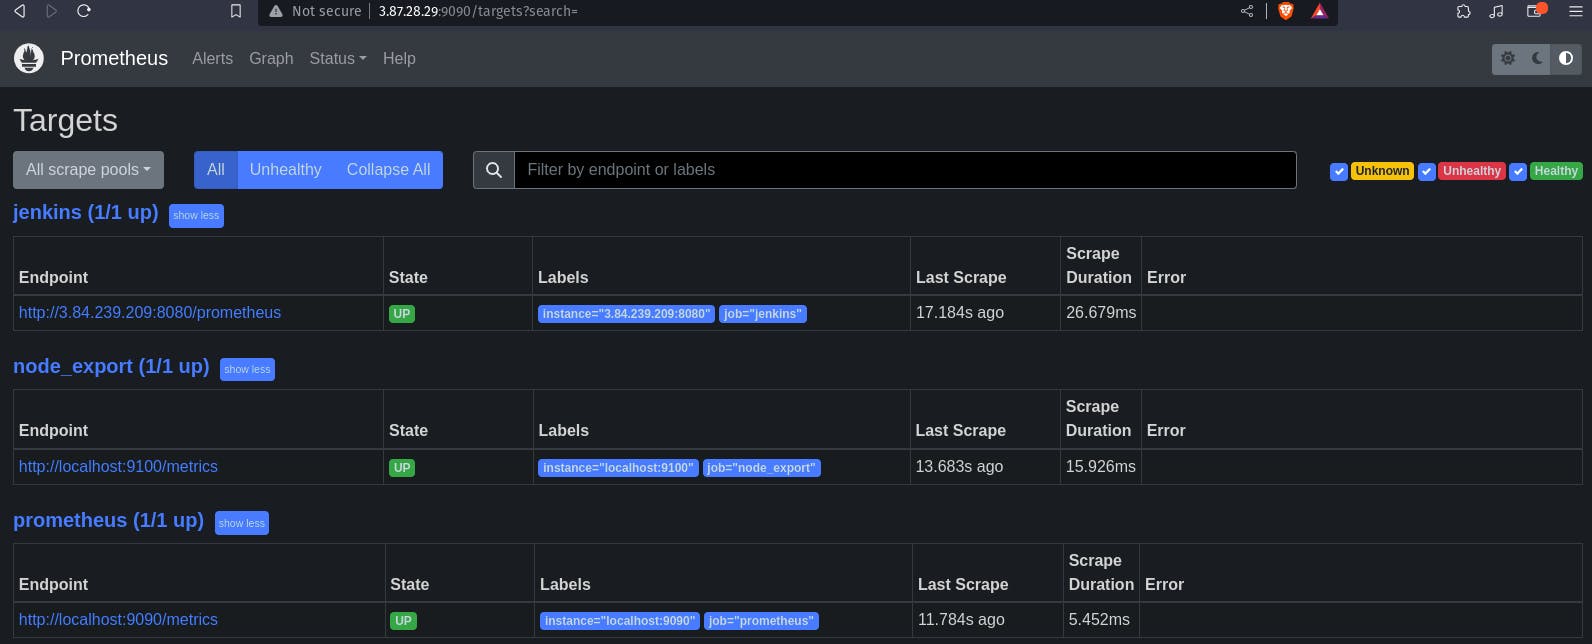
Check the targets section
http://<ip>:9090/targets
You will see Jenkins is added to it
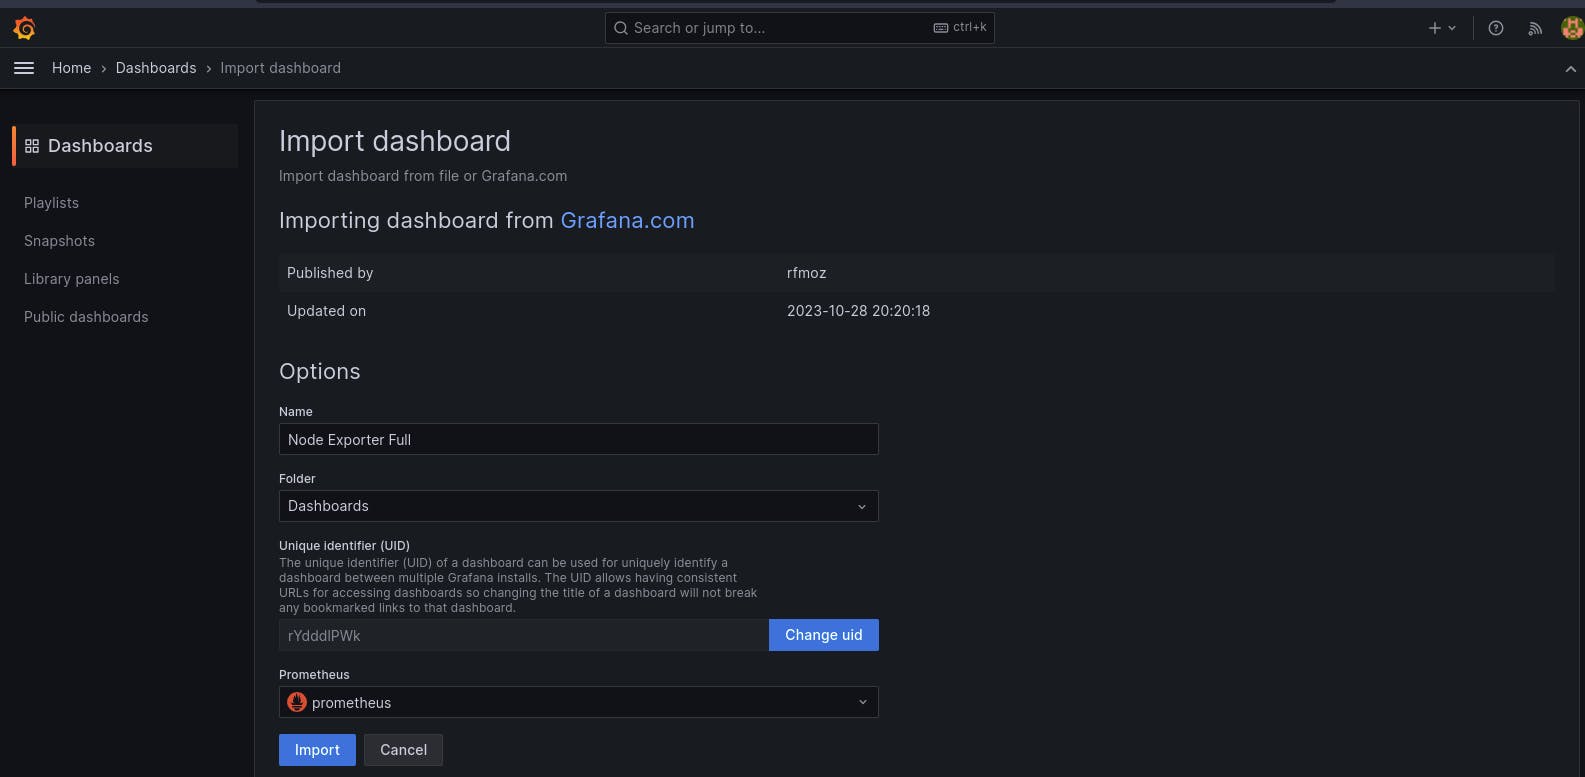
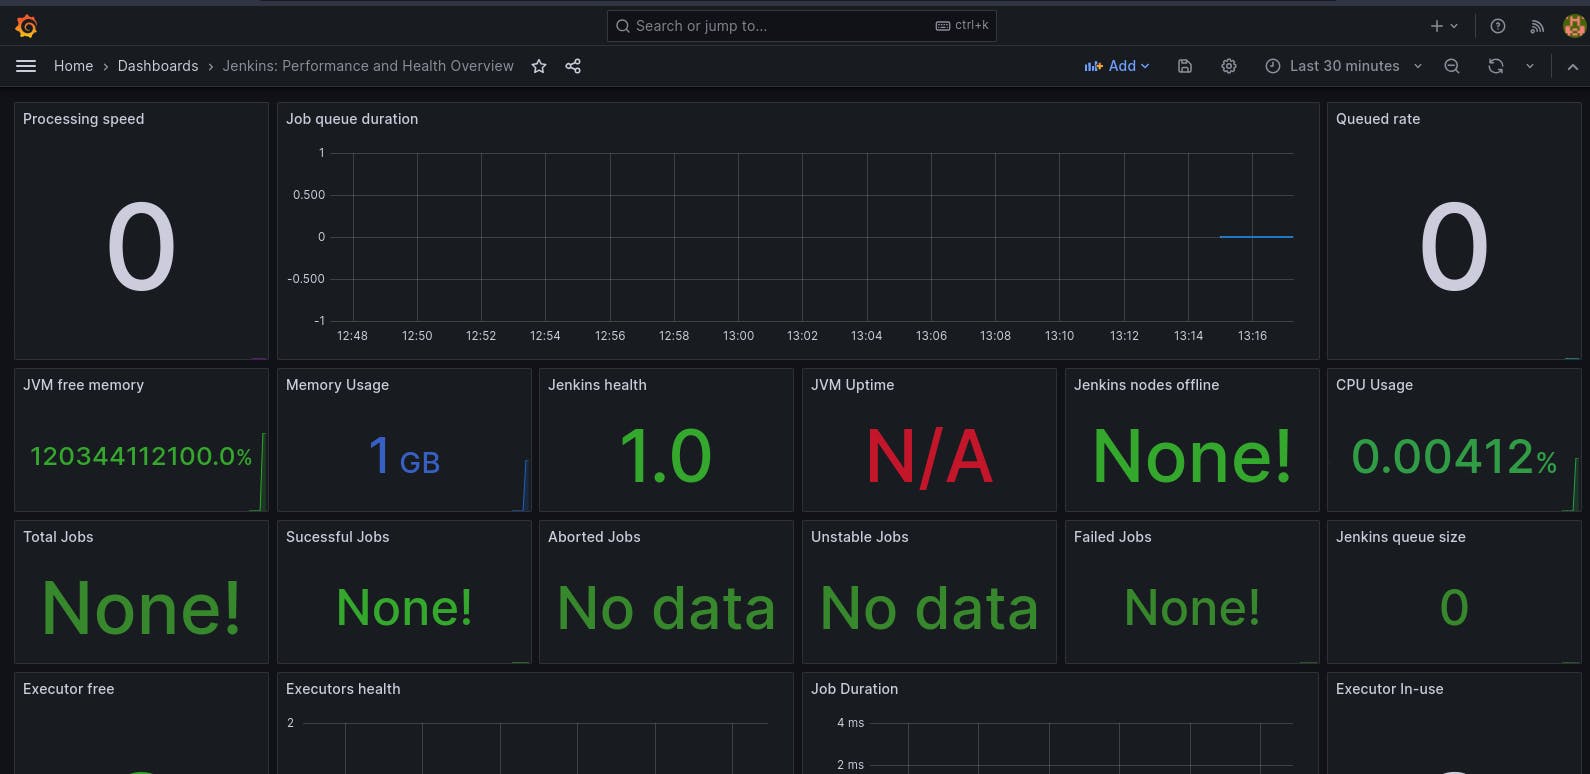
Let's add Dashboard for a better view in Grafana
Click On Dashboard --> + symbol --> Import Dashboard
Use Id 9964 and click on load.
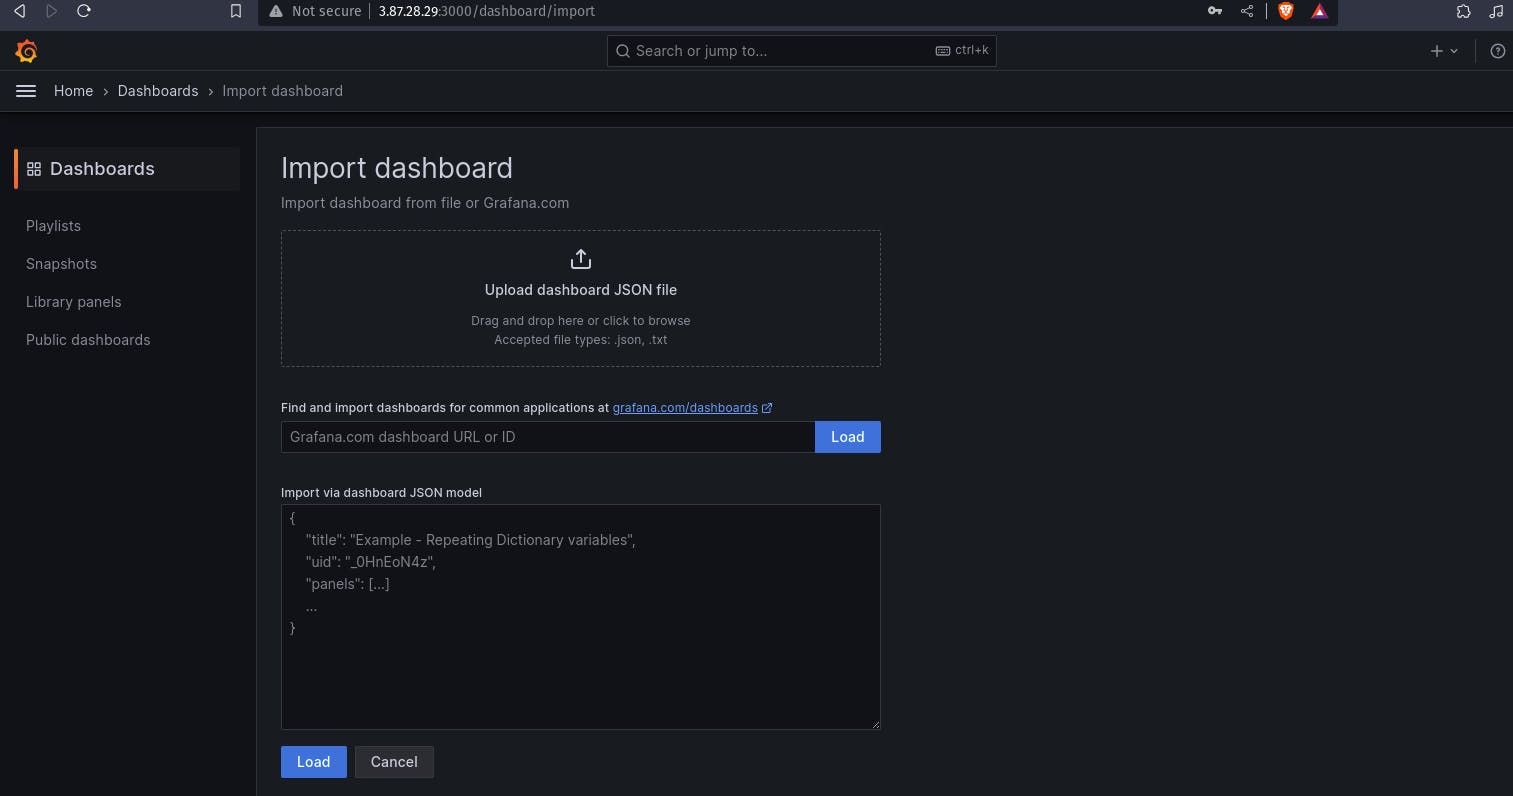
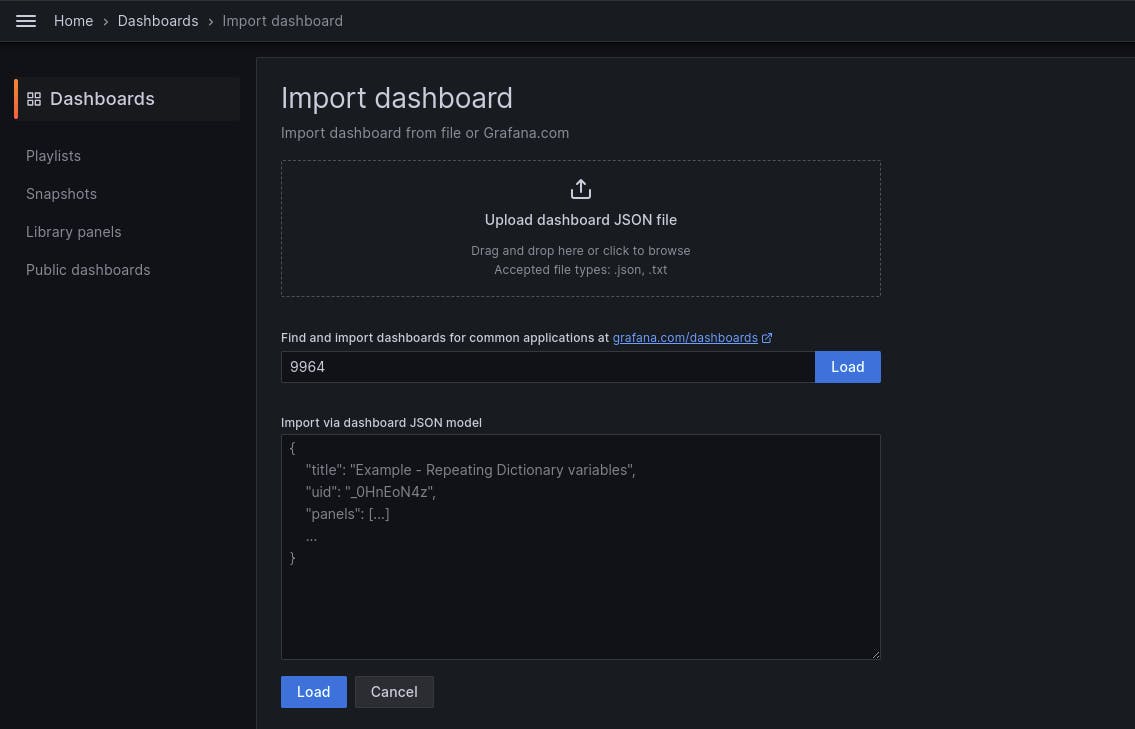
Select the data source and click on Import
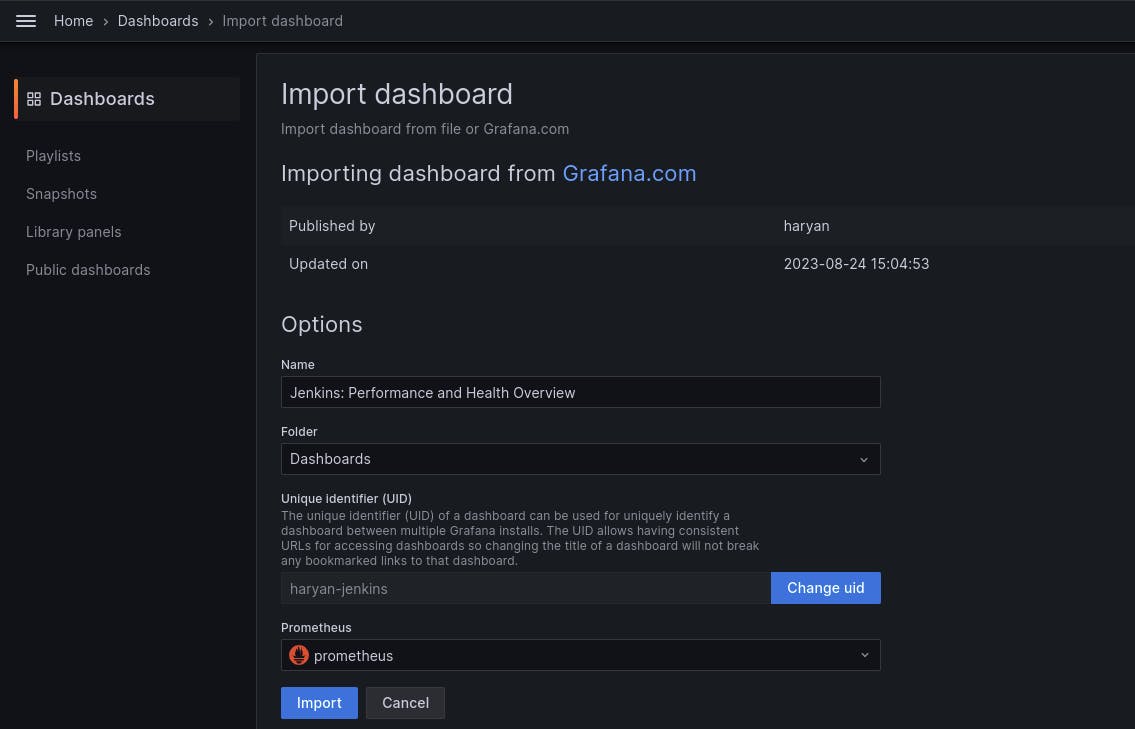
Now you will see the Detailed overview of Jenkins
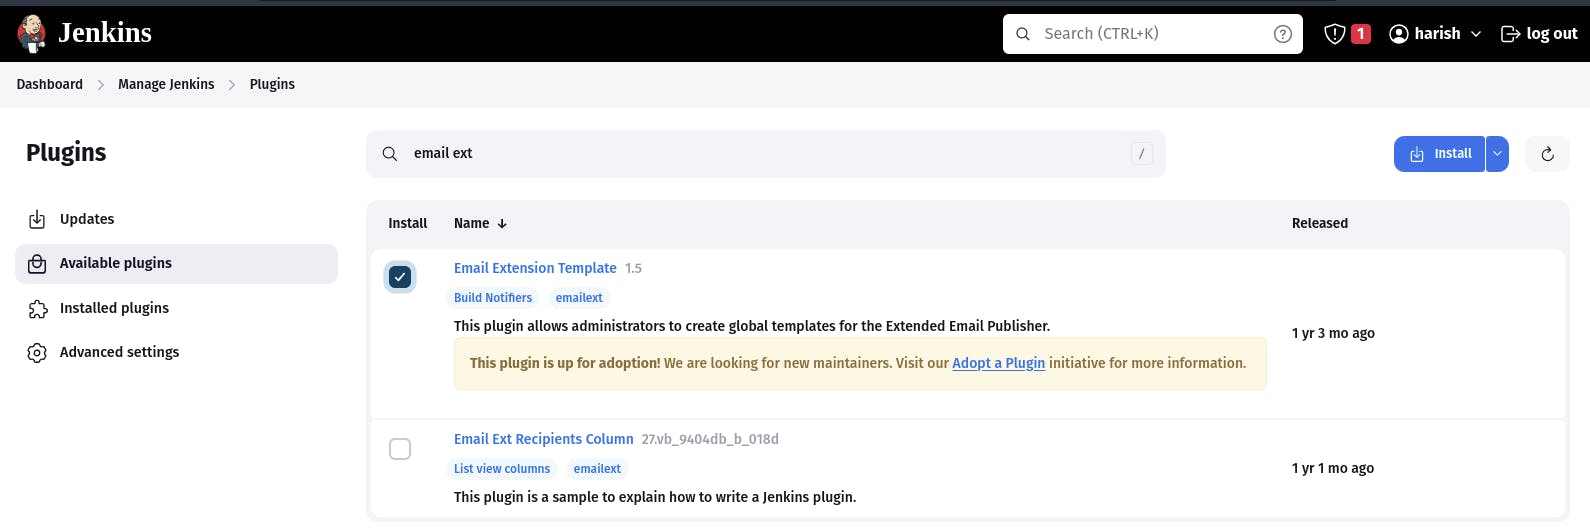
Step4: Email Integration with jenkins plugin setup
Install Email Extension Plugin in Jenkins
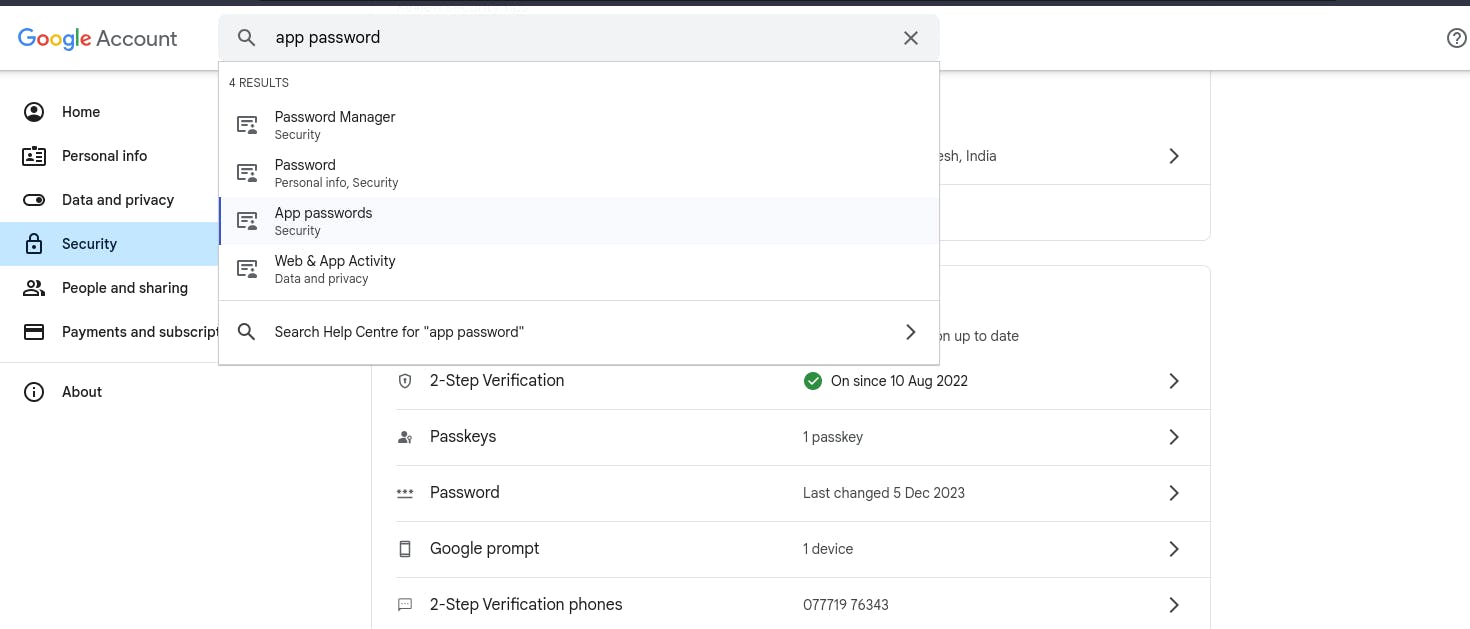
Go to your Gmail and click on your profile
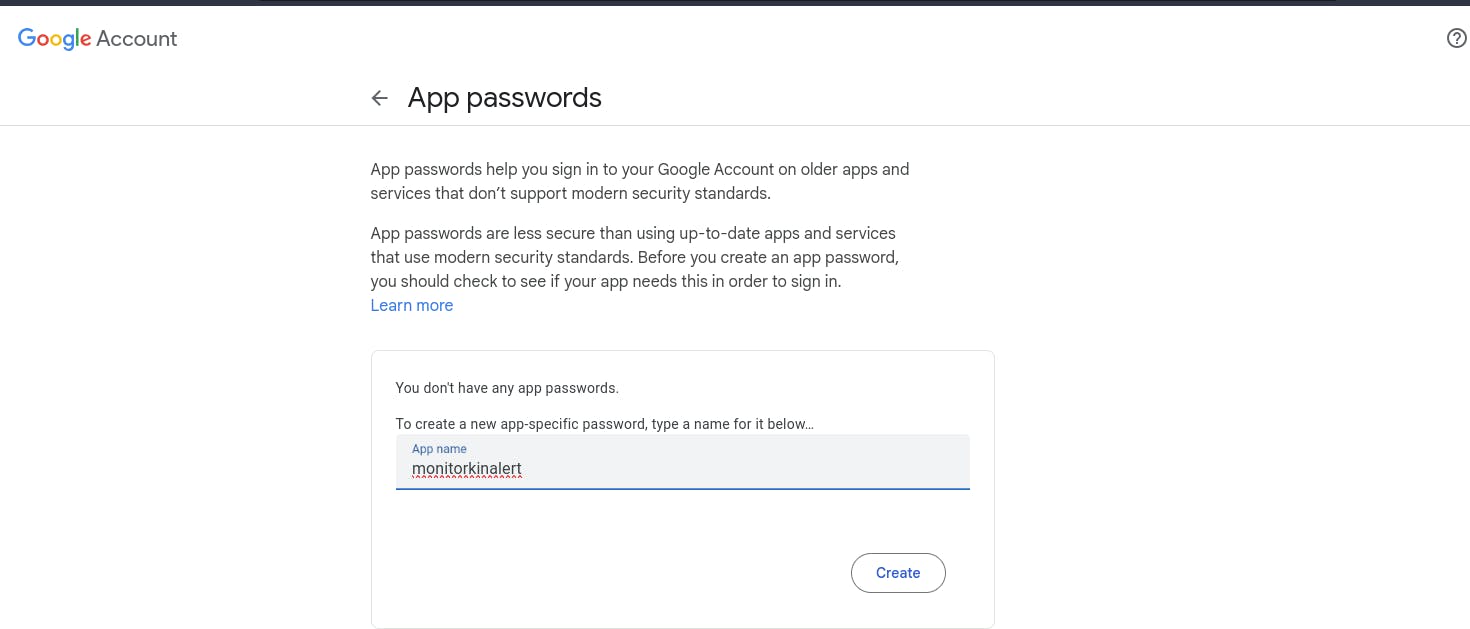
Then click on Manage Your Google Account --> click on the security tab on the left side panel you will get this page(provide mail password).
Click on other and provide your name and click on Generate and copy the password
Once the plugin is installed in Jenkins, click on manage Jenkins --> configure system there under the E-mail Notification section configure the details as shown in the below image
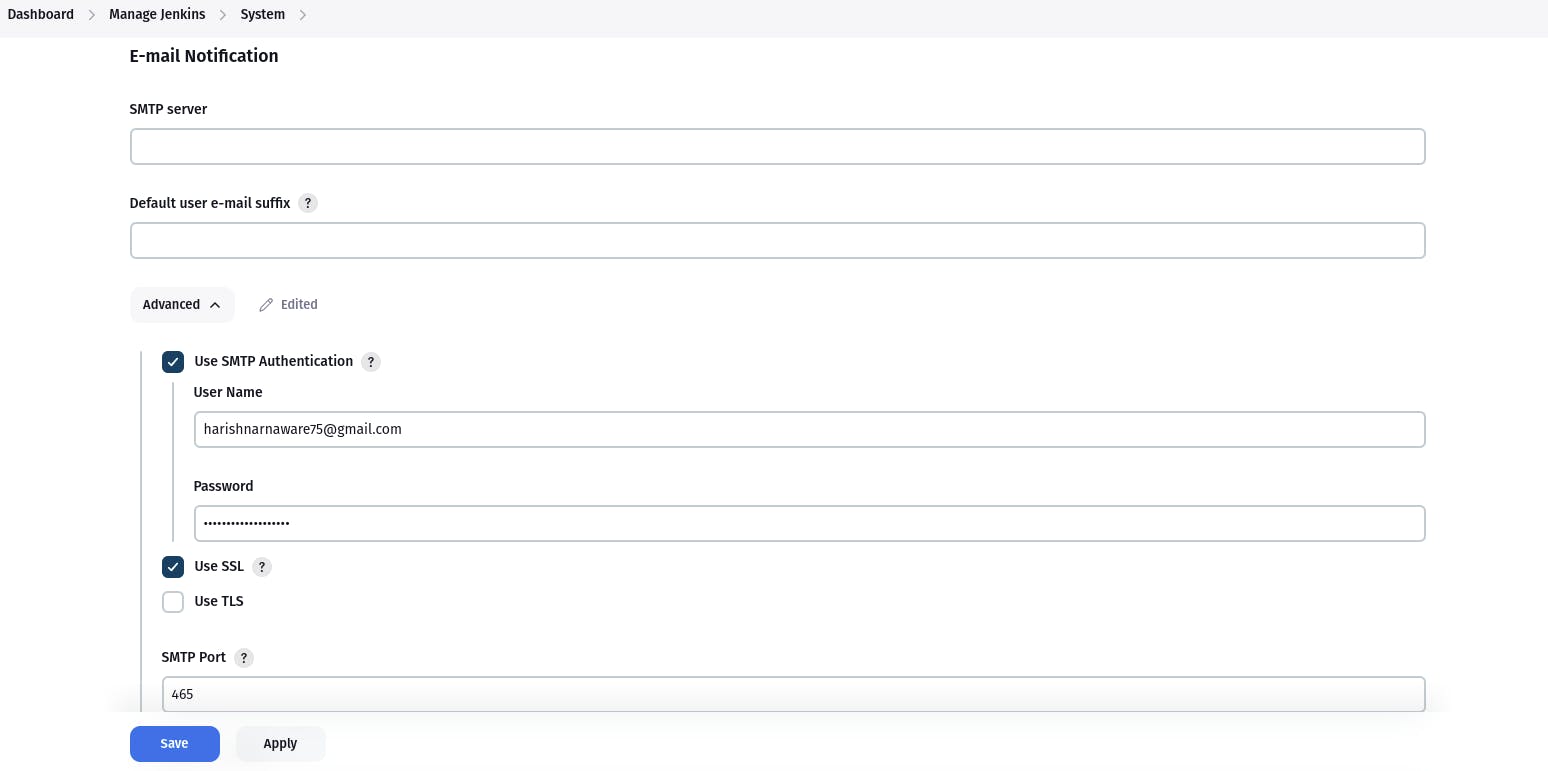
Click on Apply and save.
Click on Manage Jenkins--> credentials and add your mail username and generated password
post {
     always {
        emailext attachLog: true,
            subject: "'${currentBuild.result}'",
            body: "Project: ${env.JOB_NAME}<br/>" +
                "Build Number: ${env.BUILD_NUMBER}<br/>" +
                "URL: ${env.BUILD_URL}<br/>",
            to: 'postbox.aj99@gmail.com',  #change Your mail
            attachmentsPattern: 'trivyfs.txt,trivyimage.txt'
        }
    }
Next, we will log in to Jenkins and start to configure our Pipeline in Jenkins.
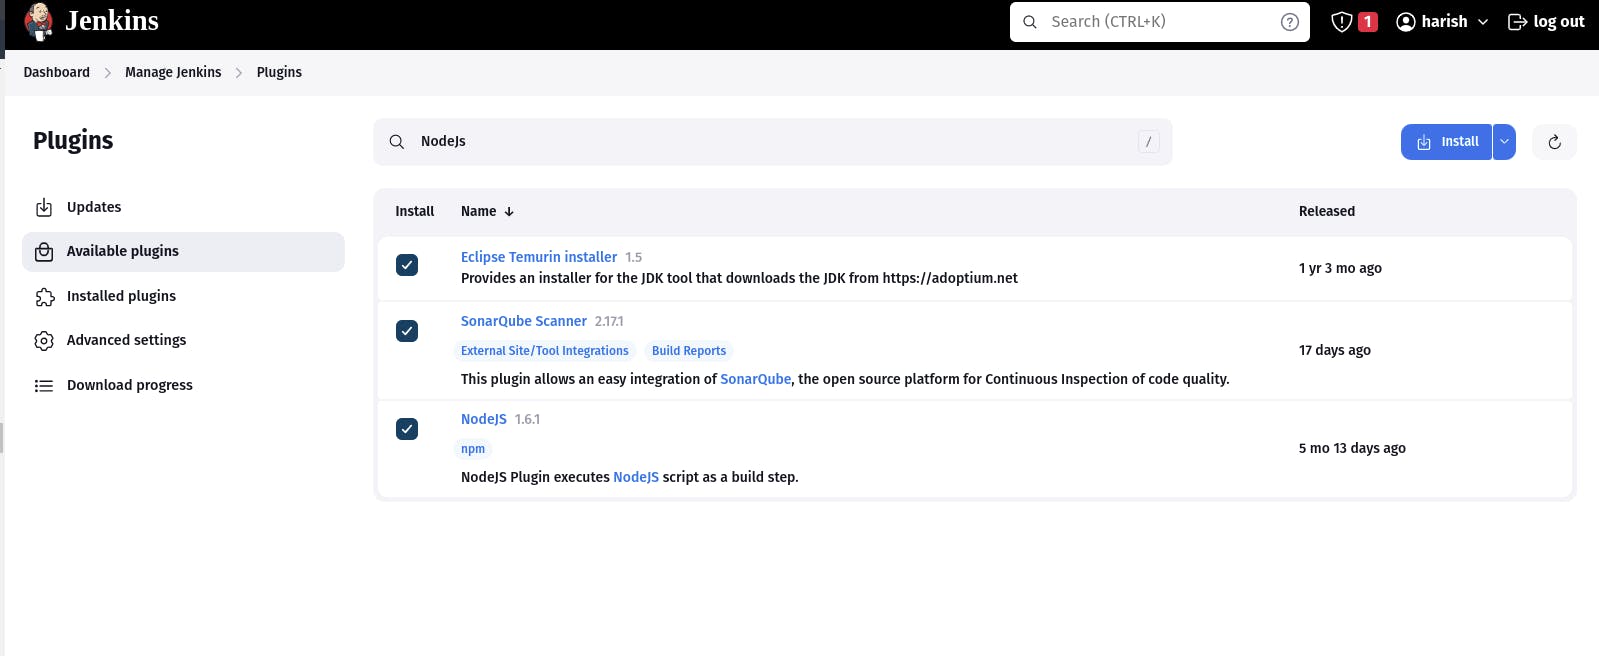
Step5: Install Plugin like JDK, Sonarqube Scanner , Nodejs , Owasp Dependency
Goto Manage Jenkins →Plugins → Available Plugins →
Install below plugins
1 → Eclipse Temurin Installer (Install without restart)
2 → SonarQube Scanner (Install without restart)
3 → NodeJs Plugin (Install Without restart)
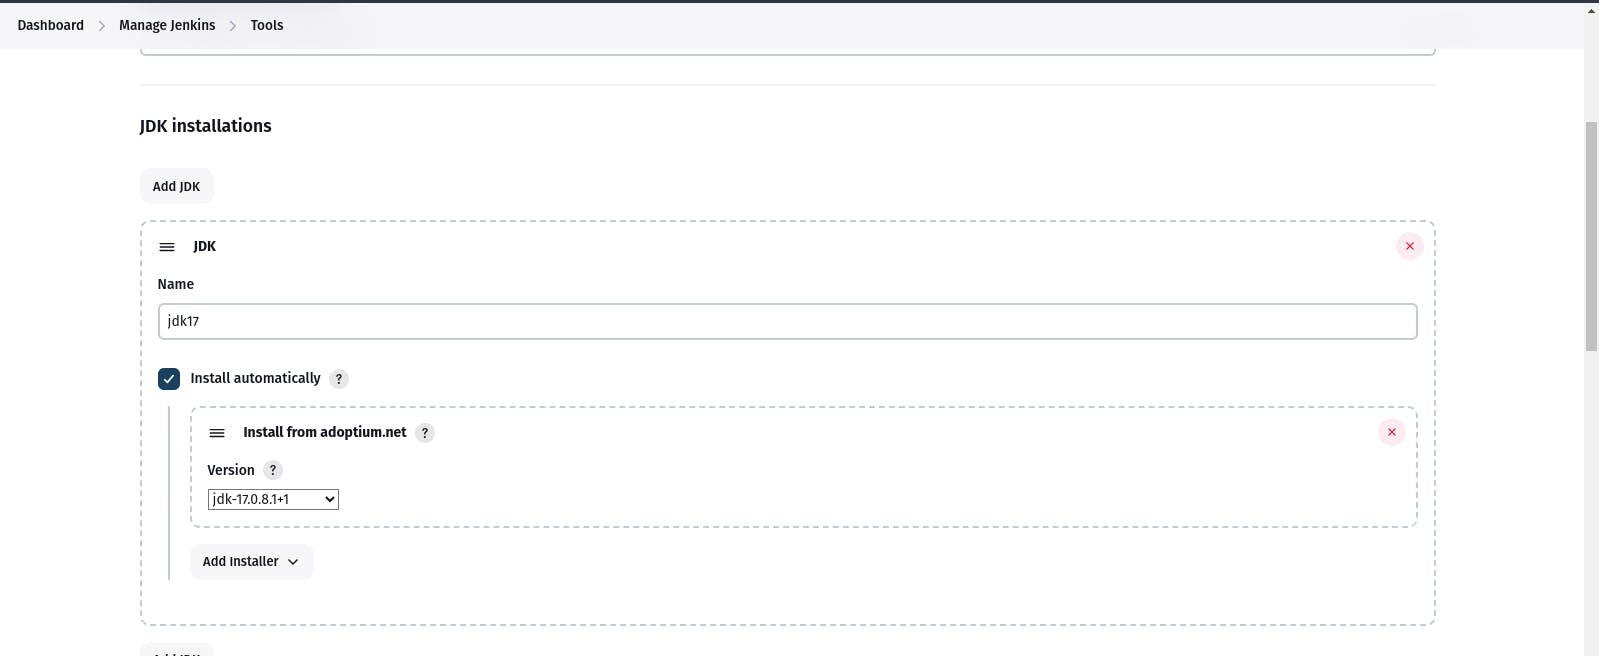
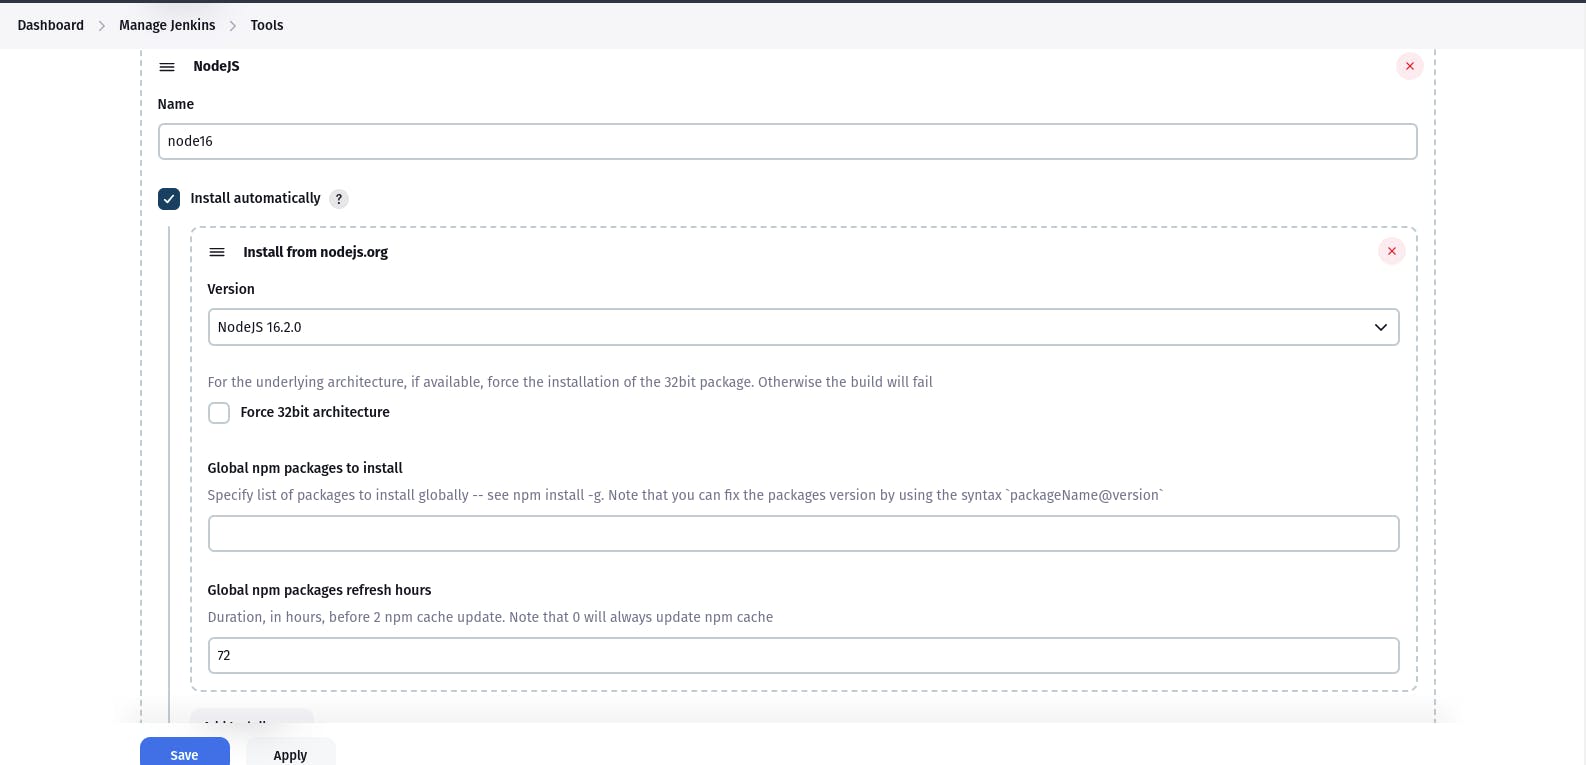
Goto Manage Jenkins → Tools → Install JDK(17) and NodeJs(16)→ Click on Apply and Save
Step6: Configure Sonar Server in Manage Jenkins.
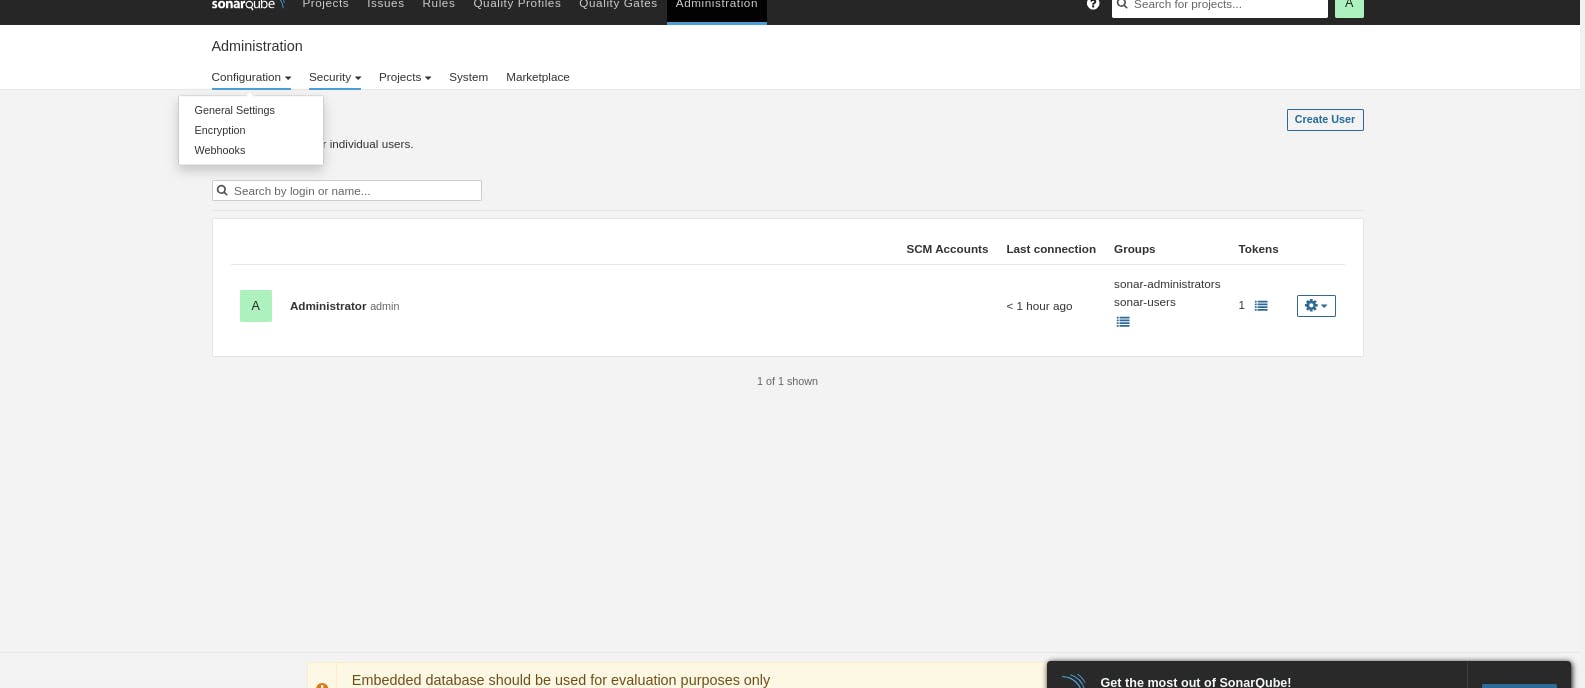
Grab the Public IP Address of your EC2 Instance, Sonarqube works on Port 9000, so <Public IP>:9000. Goto your Sonarqube Server. Click on Administration → Security → Users → Click on Tokens and Update Token → Give it a name → and click on Generate Token
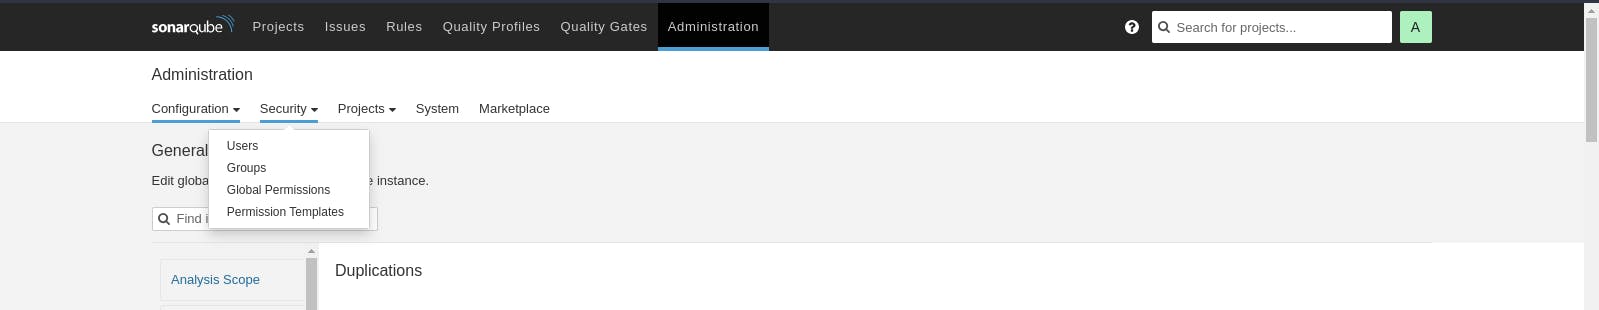
click on update Token
Create a token with a name and generate

copy Token
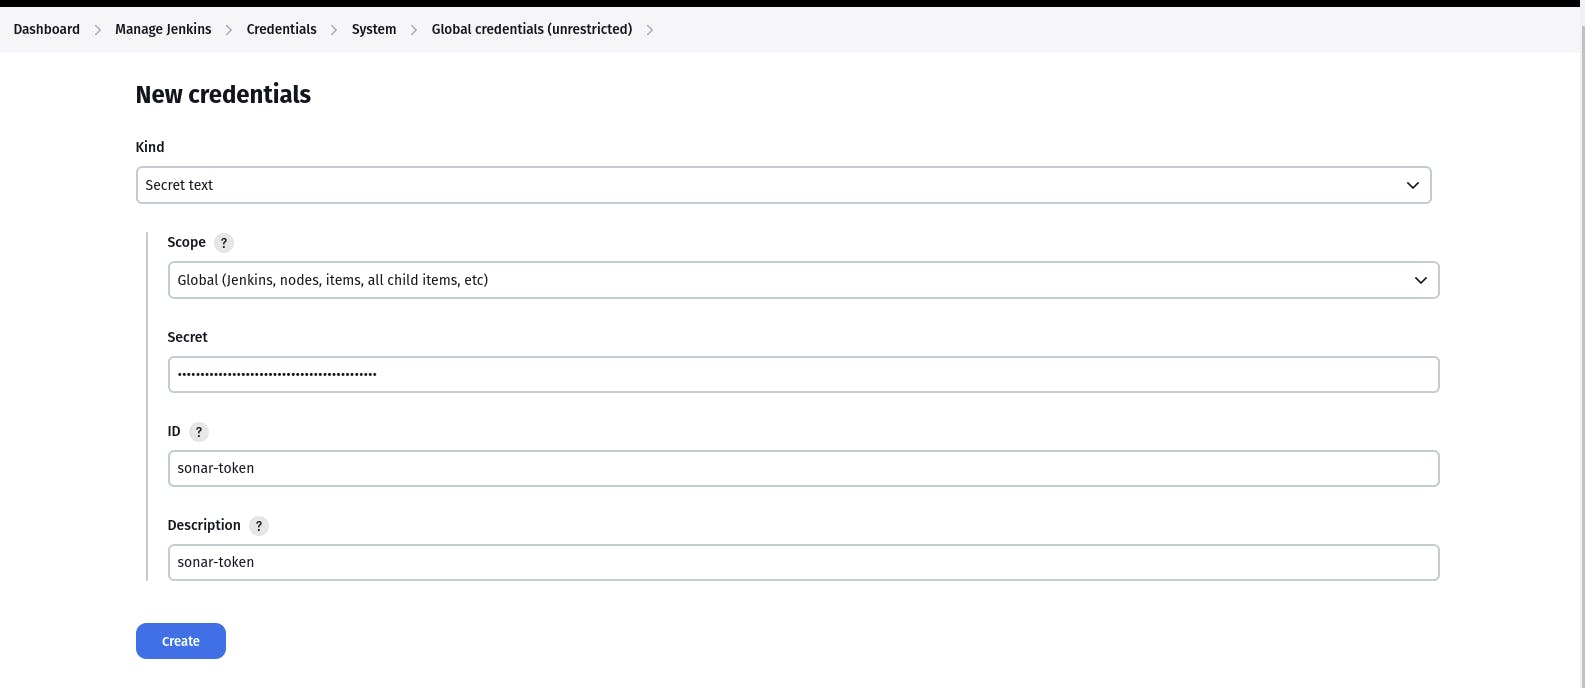
Goto Jenkins Dashboard → Manage Jenkins → Credentials → Add Secret Text. It should look like this
Now, go to Dashboard → Manage Jenkins → System and Add like the below image.
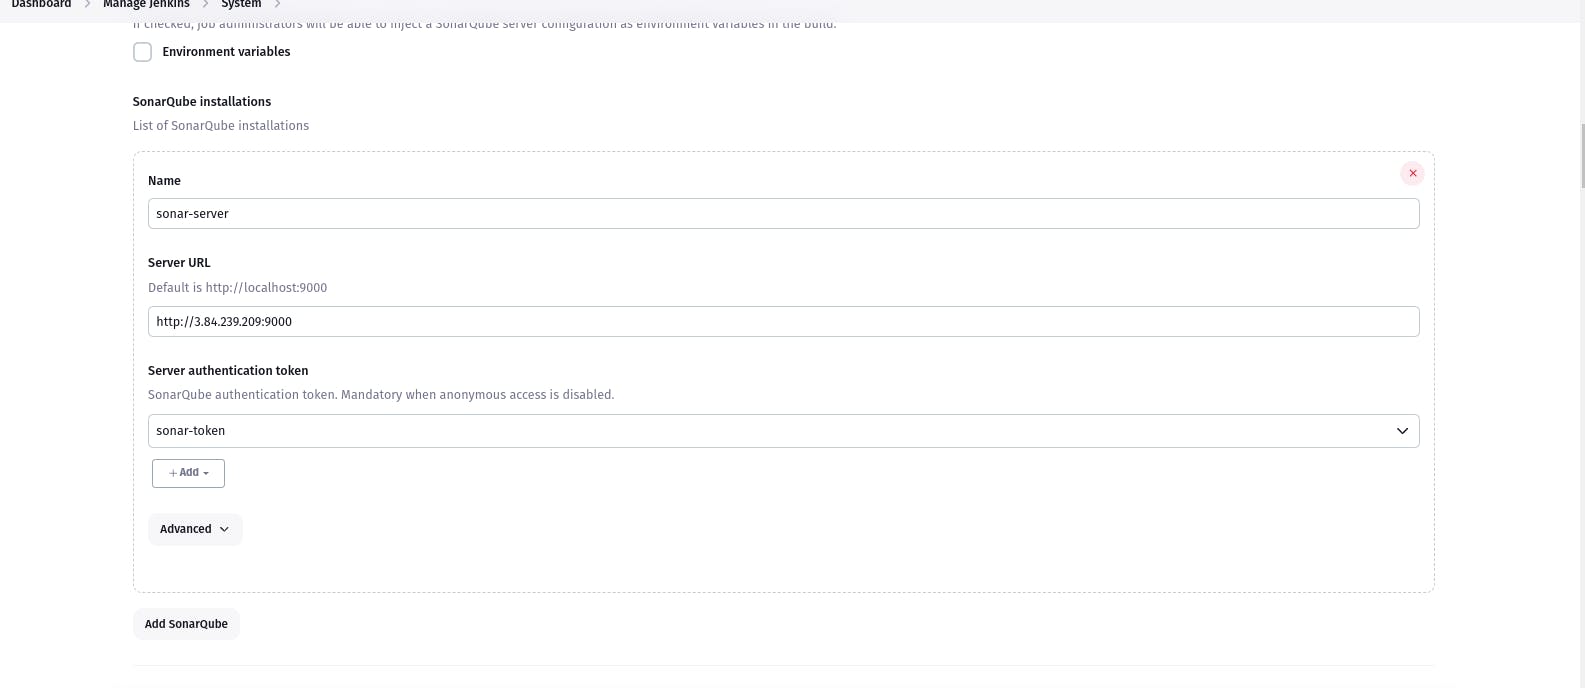
Click on Apply and Save
The Configure System option is used in Jenkins to configure different server
Global Tool Configuration is used to configure different tools that we install using Plugins
We will install a sonar scanner in the tools.

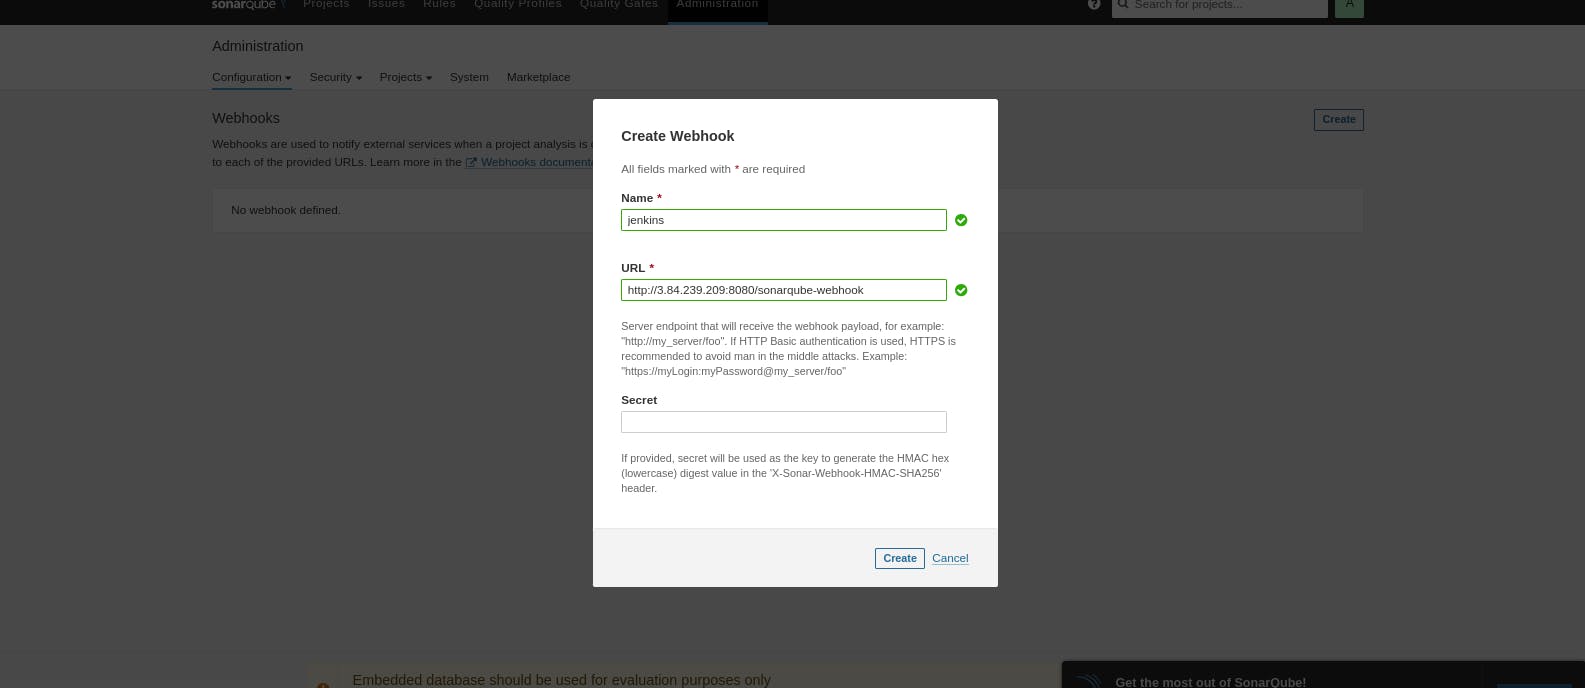
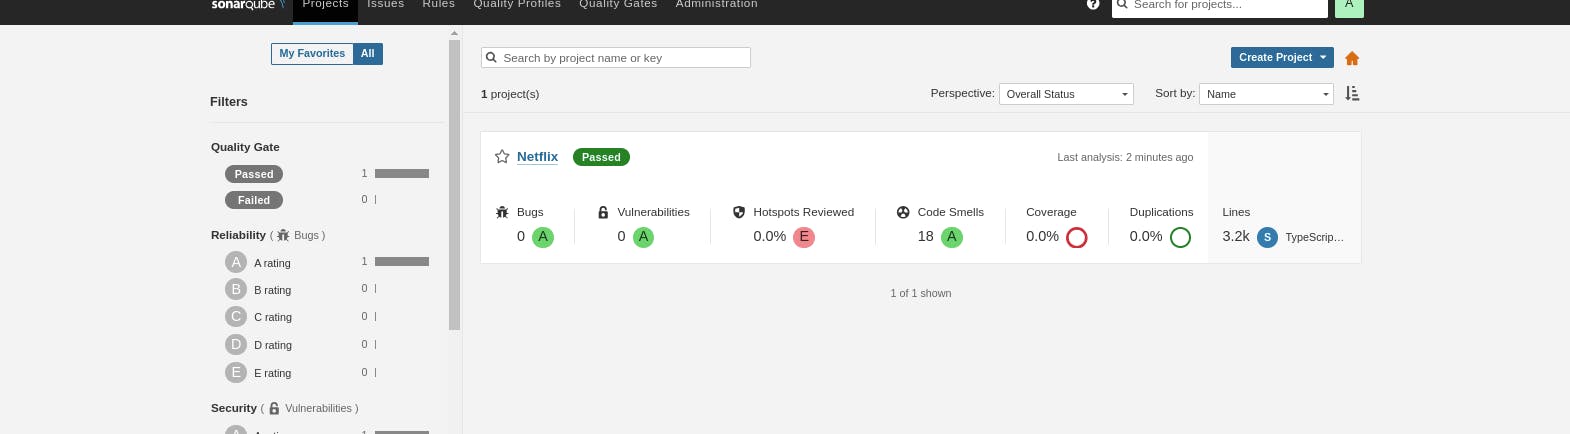
In the Sonarqube Dashboard add a quality gate also
Administration--> Configuration-->Webhooks
Click on Create
Let's go to our Pipeline and add the script in our Pipeline Script.
pipeline{
    agent any
    tools{
        jdk 'jdk17'
        nodejs 'node16'
    }
    environment {
        SCANNER_HOME=tool 'sonar-scanner'
    }
    stages {
        stage('clean workspace'){
            steps{
                cleanWs()
            }
        }
        stage('Checkout from Git'){
            steps{
                git branch: 'main', url: 'https://github.com/harish343/netflix-clone-react-typescript.git'
            }
        }
        stage("Sonarqube Analysis "){
            steps{
                withSonarQubeEnv('sonar-server') {
                    sh ''' $SCANNER_HOME/bin/sonar-scanner -Dsonar.projectName=Netflix \
                    -Dsonar.projectKey=Netflix '''
                }
            }
        }
        stage("quality gate"){
           steps {
                script {
                    waitForQualityGate abortPipeline: false, credentialsId: 'Sonar-token'
                }
            }
        }
        stage('Install Dependencies') {
            steps {
                sh "npm install"
            }
        }
    }
    post {
     always {
        emailext attachLog: true,
            subject: "'${currentBuild.result}'",
            body: "Project: ${env.JOB_NAME}<br/>" +
                "Build Number: ${env.BUILD_NUMBER}<br/>" +
                "URL: ${env.BUILD_URL}<br/>",
            to: 'harishnarnaware75@gmail.com',
            attachmentsPattern: 'trivyfs.txt,trivyimage.txt'
        }
    }
}
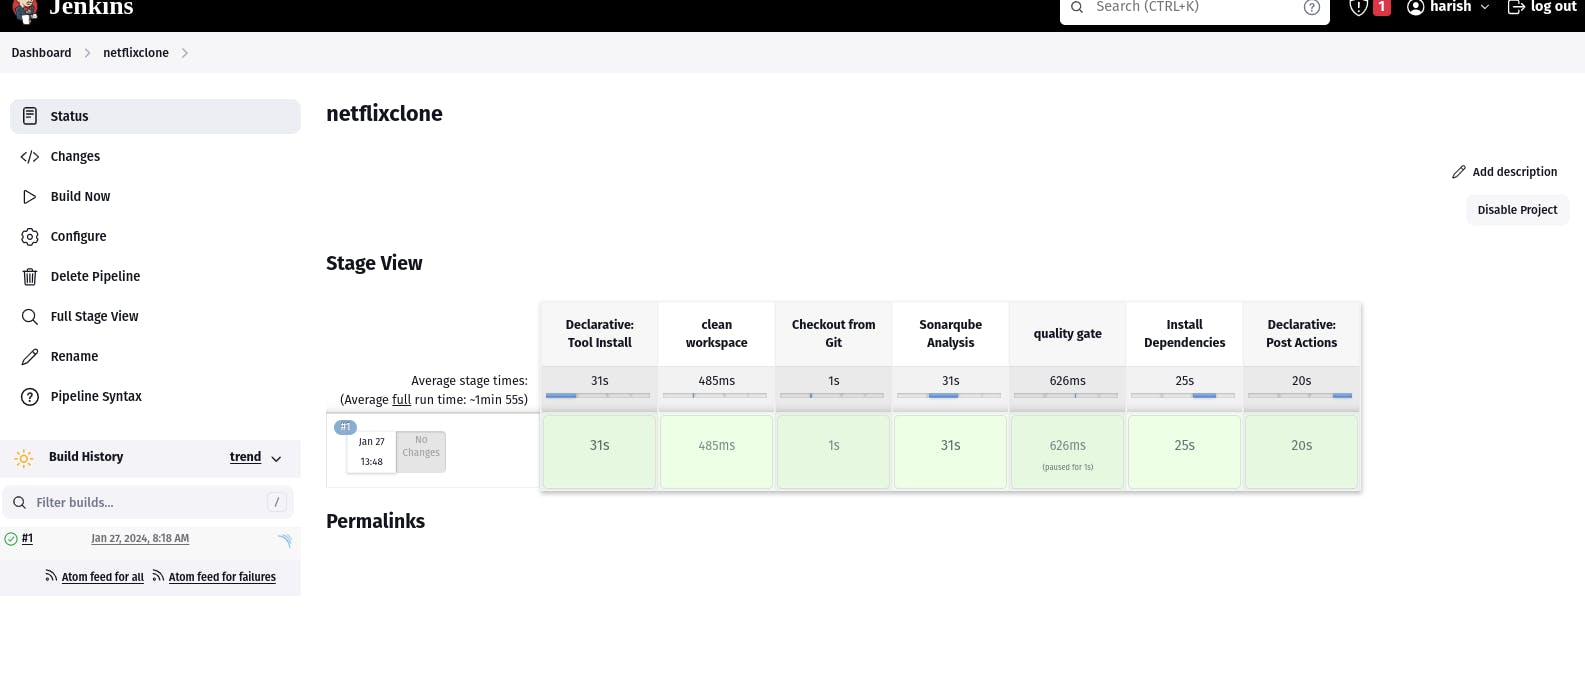
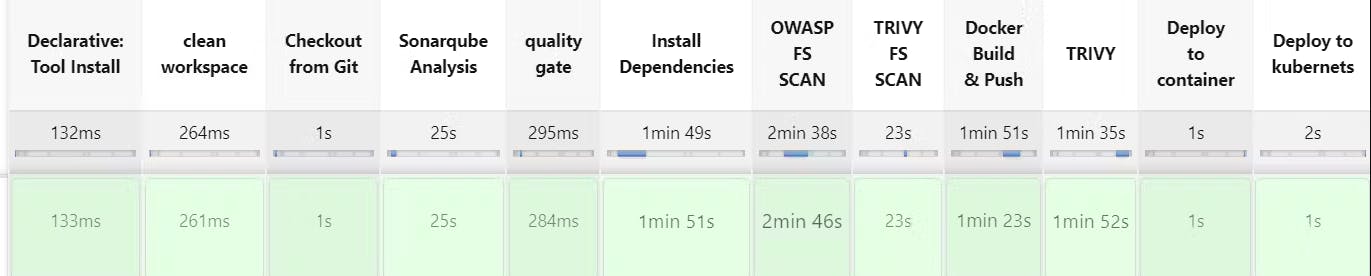
Click on Build now, you will see the stage view like this
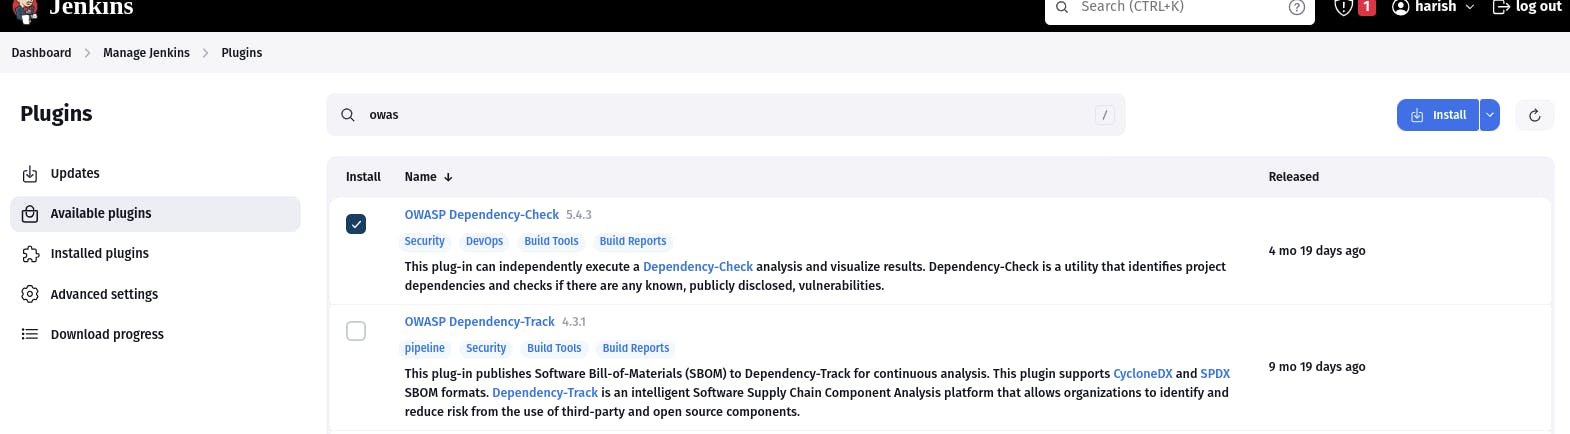
Step7: Install OWASP Dependency Check Plugins
GotoDashboard → Manage Jenkins → Plugins → OWASP Dependency-Check. Click on it and install it without restart.
First, we configured the Plugin and next, we had to configure the Tool
Goto Dashboard → Manage Jenkins → Tools →
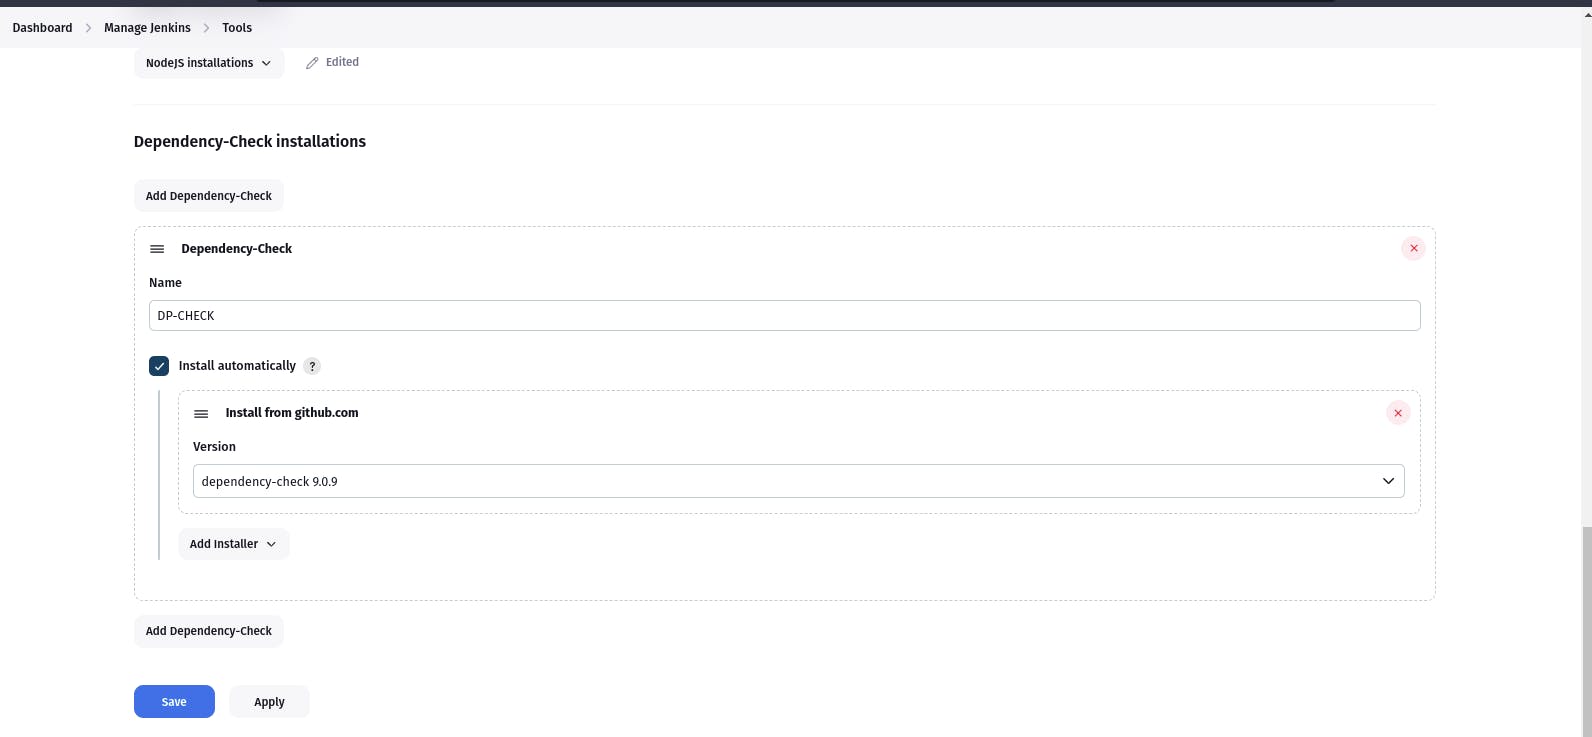
Click on Apply and Save here.
Now go configure → Pipeline and add this stage to your pipeline and build.
stage('OWASP FS SCAN') {
            steps {
                dependencyCheck additionalArguments: '--scan ./ --disableYarnAudit --disableNodeAudit', odcInstallation: 'DP-Check'
                dependencyCheckPublisher pattern: '**/dependency-check-report.xml'
            }
        }
        stage('TRIVY FS SCAN') {
            steps {
                sh "trivy fs . > trivyfs.txt"
            }
        }
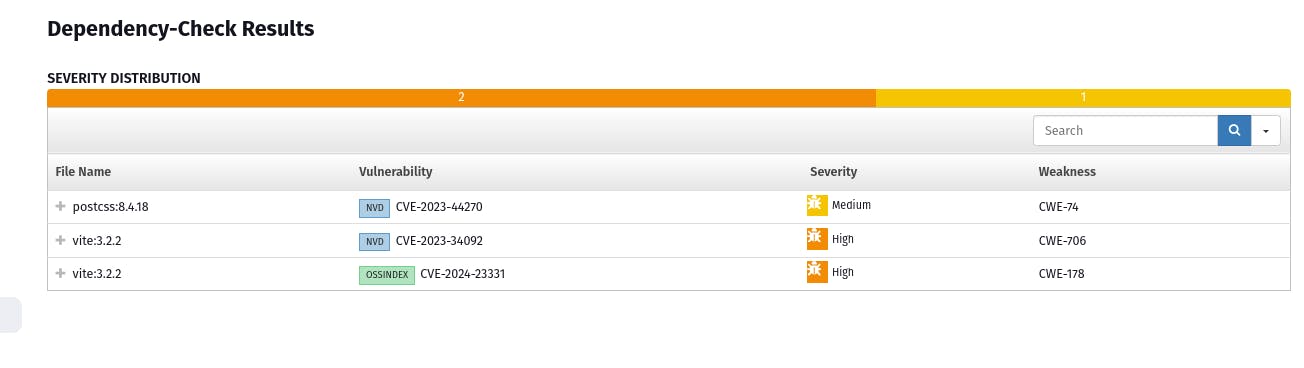
The stage view would look like this,

You will see that in status, a graph will also be generated and Vulnerabilities.
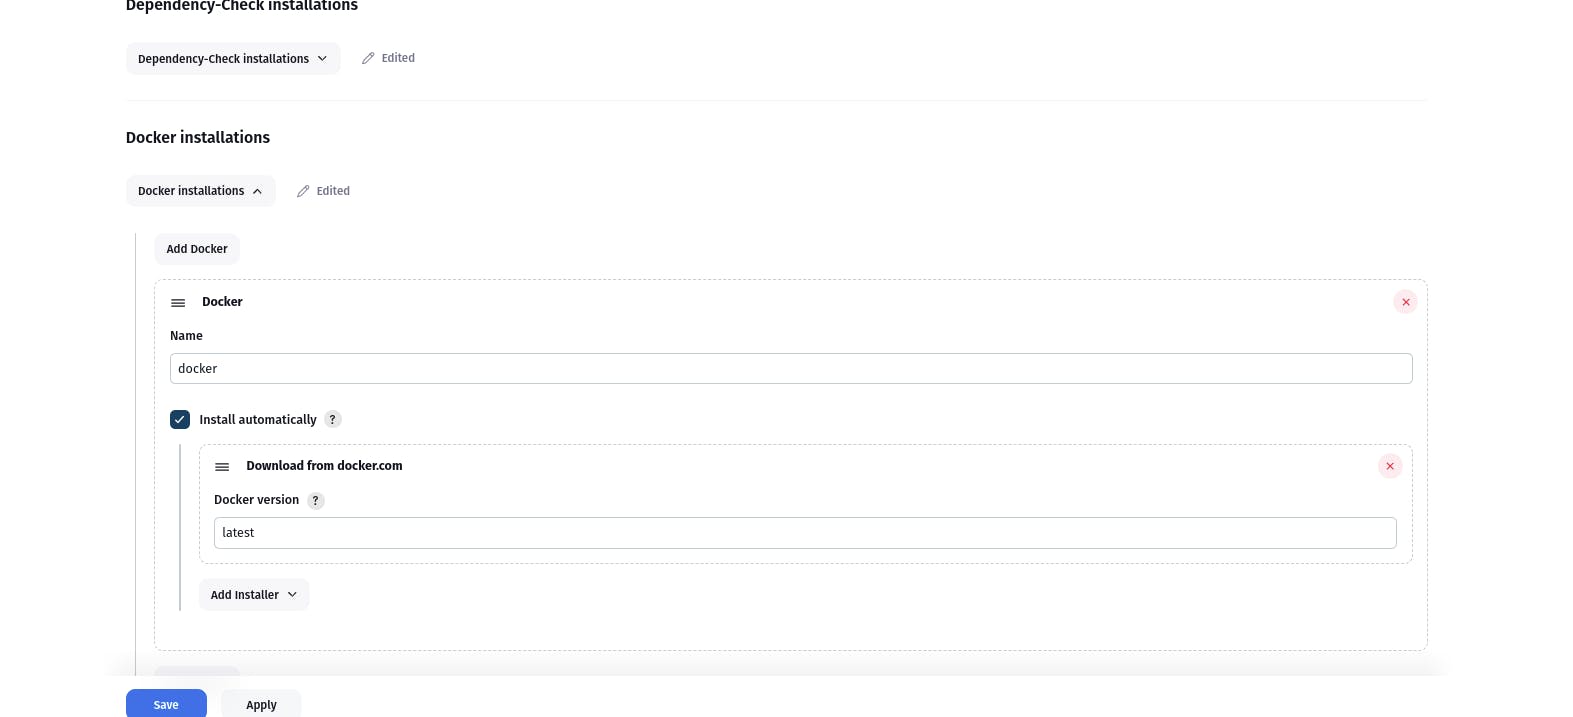
Step8: Docker Image Build and Push
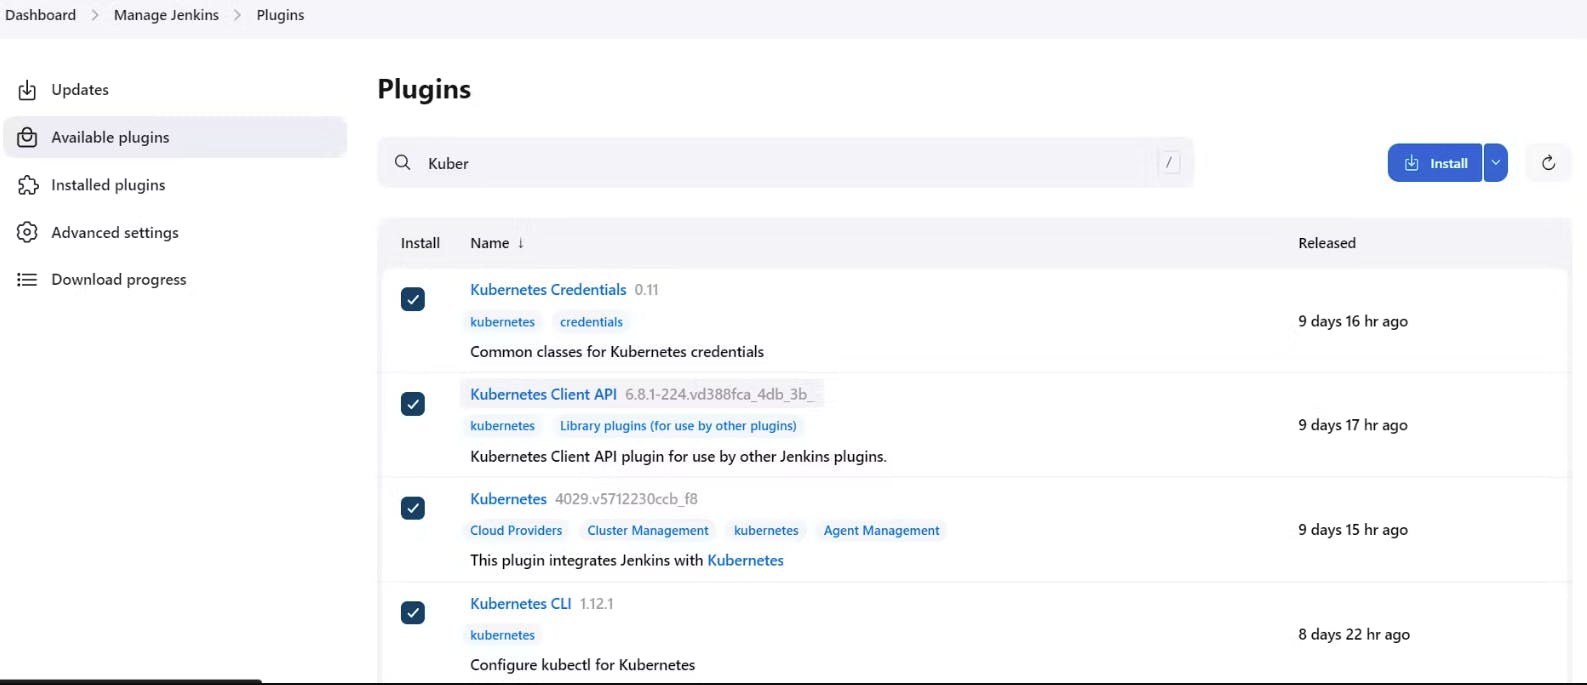
We need to install the Docker tool in our system, Goto Dashboard → Manage Plugins → Available plugins → Search for Docker and install these plugins
Docker
Docker Commons
Docker Pipeline
Docker API
docker-build-step
Now, goto Dashboard → Manage Jenkins → Tools →
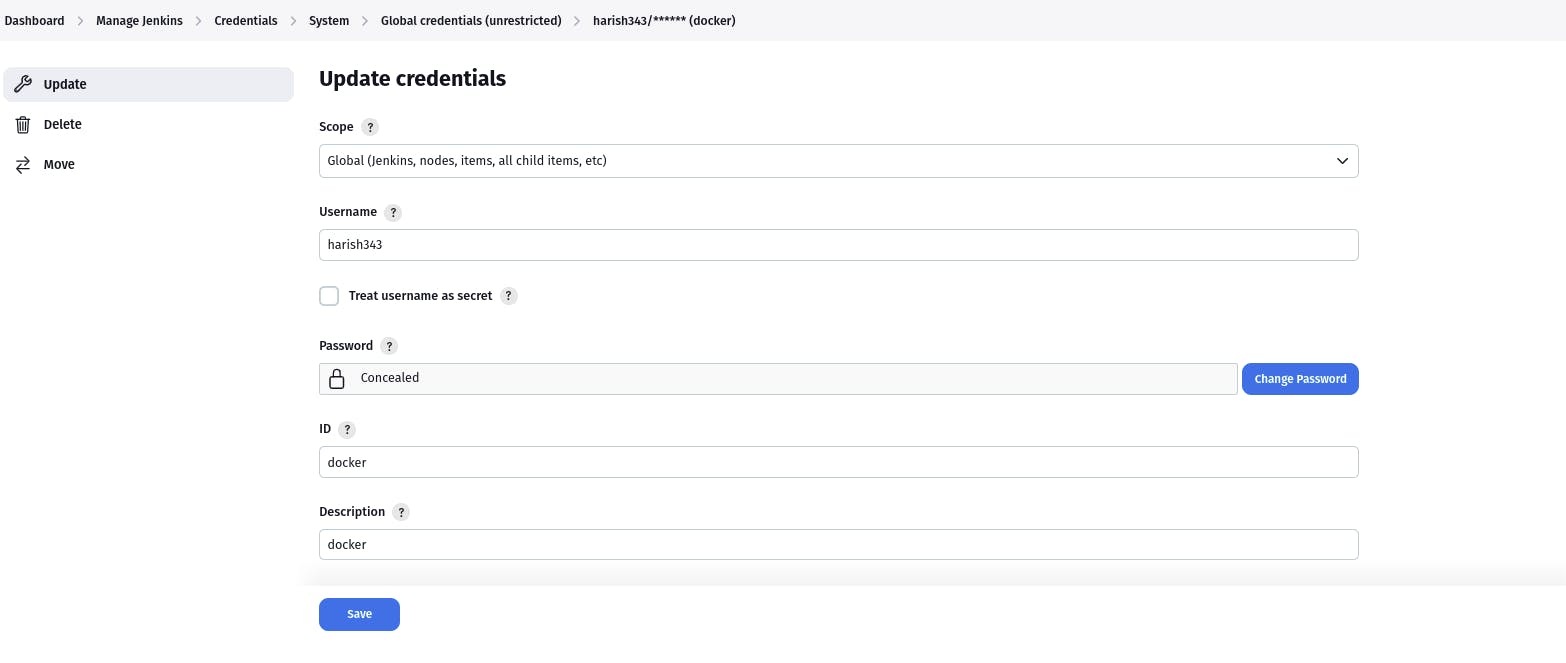
Add DockerHub Username and Password under Global Credentials
Add this stage to Pipeline Script
stage("Docker Build & Push"){
            steps{
                script{
                   withDockerRegistry(credentialsId: 'docker', toolName: 'docker'){
                       sh "docker build --build-arg TMDB_V3_API_KEY=Aj7ay86fe14eca3e76869b92 -t netflix ."
                       sh "docker tag netflix sevenajay/netflix:latest "
                       sh "docker push sevenajay/netflix:latest "
                    }
                }
            }
        }
        stage("TRIVY"){
            steps{
                sh "trivy image sevenajay/netflix:latest > trivyimage.txt"
            }
        }
Kubernetes setup
pipeline{
    agent any
    tools{
        jdk 'jdk17'
        nodejs 'node16'
    }
    environment {
        SCANNER_HOME=tool 'sonar-scanner'
    }
    stages {
        stage('clean workspace'){
            steps{
                cleanWs()
            }
        }
        stage('Checkout from Git'){
            steps{
                git branch: 'main', url: 'https://github.com/harish343/netflixclone.git'
            }
        }
        stage("Sonarqube Analysis "){
            steps{
                withSonarQubeEnv('sonar-server') {
                    sh ''' $SCANNER_HOME/bin/sonar-scanner -Dsonar.projectName=Netflix \
                    -Dsonar.projectKey=Netflix '''
                }
            }
        }
        stage("quality gate"){
           steps {
                script {
                    waitForQualityGate abortPipeline: false, credentialsId: 'Sonar-token'
                }
            }
        }
        stage('Install Dependencies') {
            steps {
                sh "npm install"
            }
        }
        stage('OWASP FS SCAN') {
            steps {
                dependencyCheck additionalArguments: '--scan ./ --disableYarnAudit --disableNodeAudit', odcInstallation: 'DP-Check'
                dependencyCheckPublisher pattern: '**/dependency-check-report.xml'
            }
        }
        stage('TRIVY FS SCAN') {
            steps {
                sh "trivy fs . > trivyfs.txt"
            }
        }
        stage("Docker Build & Push"){
            steps{
                script{
                   withDockerRegistry(credentialsId: 'docker', toolName: 'docker'){
                       sh "docker build --build-arg TMDB_V3_API_KEY=AJ7AYe14eca3e76864yah319b92 -t netflix ."
                       sh "docker tag netflix harish343/netflix:latest "
                       sh "docker push harish343/netflix:latest "
                    }
                }
            }
        }
        stage("TRIVY"){
            steps{
                sh "trivy image harish343/netflix:latest > trivyimage.txt"
            }
        }
        stage('Deploy to container'){
            steps{
                sh 'docker run -d --name netflix -p 8081:80 harish343/netflix:latest'
            }
        }
        stage('Deploy to kubernets'){
            steps{
                script{
                    dir('Kubernetes') {
                        withKubeConfig(caCertificate: '', clusterName: '', contextName: '', credentialsId: 'k8s', namespace: '', restrictKubeConfigAccess: false, serverUrl: '') {
                                sh 'kubectl apply -f deployment.yml'
                                sh 'kubectl apply -f service.yml'
                        }
                    }
                }
            }
        }
    }
    post {
     always {
        emailext attachLog: true,
            subject: "'${currentBuild.result}'",
            body: "Project: ${env.JOB_NAME}<br/>" +
                "Build Number: ${env.BUILD_NUMBER}<br/>" +
                "URL: ${env.BUILD_URL}<br/>",
            to: '<gmailaddress>',
            attachmentsPattern: 'trivyfs.txt,trivyimage.txt'
        }
    }
}
Step9: Kubernetes Setup
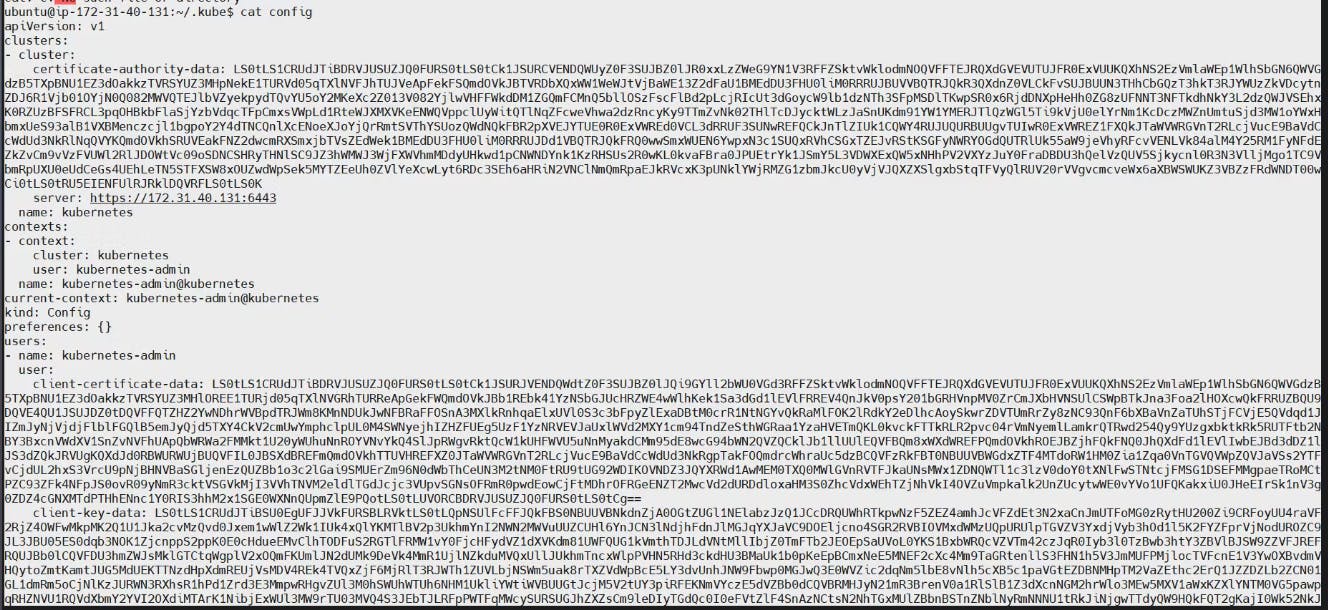
Setup kubernetes cluster setup with 2 ec2 worker node and 1 master node copy kubeconfig file.
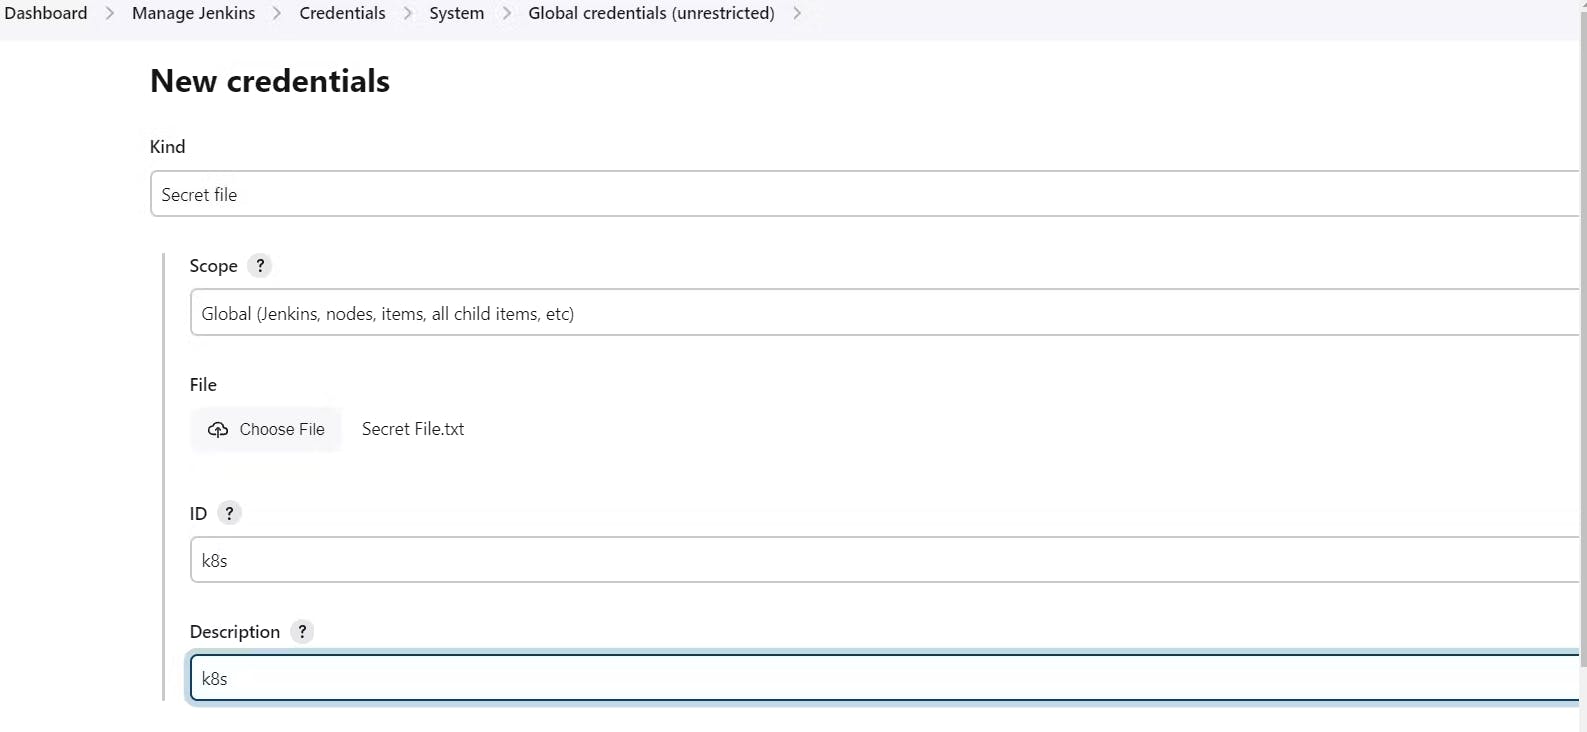
copy it and save it in documents or another folder save it as secret-file.txt
Note: create a secret-file.txt in your file explorer save the config in it and use this at the kubernetes credential section.
Install Kubernetes Plugin, Once it’s installed successfully
goto manage Jenkins –> manage credentials –> Click on Jenkins global –> add credentials
you are successfully configure to use kubernetes cluster in jenkins.
run pipeline.

your react app clone has been deployed in kubernetes cluster you can also deploy this EKS cluster.