Infrastructure Provisioning with Terrafom and monitoring EKS cluster and ec2 Instance with Amazon Managed Prometheus


HLD

Steps for deploy infrastructure
Here is my gihub link clone my repo
make changes according to your need you can change instance type open port and add more automation instance and development server.
here you can give your instances for monitoring.
terraform init
apply terraform
terraform apply
now its time to install prometheus agent in EKS cluster but first update kubeconfig file.

first apply kubernetes custom resource defination.

kubectl create -f prometheus-operator-crd/
apply prometheus operator.

kubectl apply -f prometheus-operator/
apply prometheus agent file before applying make some changes.
---
apiVersion: v1
kind: ServiceAccount
metadata:
  name: prometheus
  namespace: monitoring
  annotations:
    eks.amazonaws.com/role-arn: "arn:aws:iam::<AccountID>:role/prometheus-demo"
change account ID with your account ID.
---
apiVersion: monitoring.coreos.com/v1
kind: Prometheus
metadata:
  name: agent
  namespace: monitoring
spec:
  version: v2.39.1
  serviceAccountName: prometheus
  serviceMonitorSelector:
    matchLabels:
      component: prometheus-agent
  serviceMonitorNamespaceSelector:
    matchLabels:
      monitoring: prometheus-agent
  resources:
    requests:
      cpu: 500m
      memory: 1Gi
    limits:
      cpu: 500m
      memory: 1Gi
  replicas: 1
  logLevel: debug
  logFormat: logfmt
  scrapeInterval: 30s
  remoteWrite:
  # TODO: replace with your workspace
  - url: https://aps-workspaces.us-east-1.amazonaws.com/workspaces/ws-c7jh8297-f39e-4166-9a03-bc7451379d83/api/v1/remote_write
    sigv4:
      region: us-east-1
    queueConfig:
      maxSamplesPerSend: 1000
      maxShards: 200
      capacity: 2500
  containers:
  - name: prometheus
    args:
    - --config.file=/etc/prometheus/config_out/prometheus.env.yaml
    - --storage.agent.path=/prometheus
    - --enable-feature=agent
    - --web.enable-lifecycle
  # OPTIONAL: only if you have standalone EC2 instances to scare
  additionalScrapeConfigs:
    name: additional-scrape-configs
    key: prometheus-additional.yaml
change url with your url workspace.
put Endpoint remote write url.

after that apply prometheus agent yaml folder.
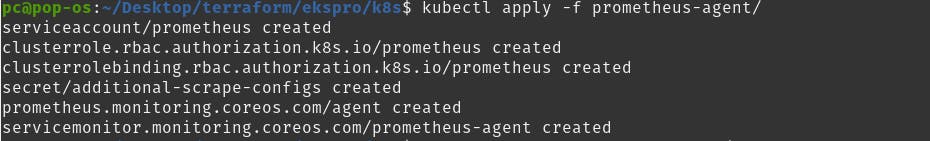
kubectl apply -f prometheus-agent/
apply node exporter.

kubectl apply -f node-exporter/
apply kube-state-metrics.

kubectl apply -f kube-state-metrics
apply ca advisor.

kubectl apply -f cadvisor

check you monitoring resources.
before applying grafana yaml lets made some changes.
In service-account.yaml change your account ID with your account ID
---
apiVersion: v1
kind: ServiceAccount
metadata:
  name: grafana
  namespace: monitoring
  annotations:
    eks.amazonaws.com/role-arn: "arn:aws:iam::<AccountID>:role/grafana-demo"
You can change grafana password from there.
username
echo -n "devops123" | base64
make password
echo -n "admin" | base64
---
apiVersion: v1
kind: Secret
metadata:
  namespace: monitoring
  name: grafana
type: Opaque
data:
  admin-user: "YWRtaW4="
  admin-password: "ZGV2b3BzMTIz"
Make sure put encode password.
put your grafana datasource url

put endpoint query url
---
apiVersion: v1
kind: ConfigMap
metadata:
  name: datasources
  namespace: monitoring
data:
  datasources.yaml: |
    apiVersion: 1
    datasources:
    - access: proxy
      isDefault: true
      name: Managed Prometheus
      type: prometheus
      url: https://aps-workspaces.us-east-1.amazonaws.com/workspaces/ws-c72f8787-f39e-4166-9a03-bc7451379d83
      jsonData:
        sigV4Auth: true
        sigV4Region: us-east-1
        sigV4AuthType: default

Port-forward grafana service
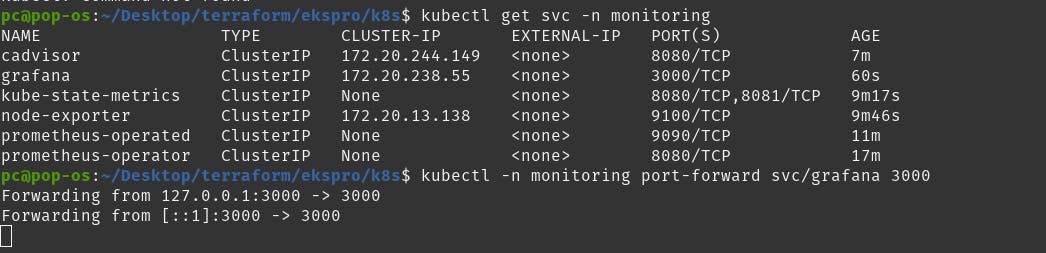
kubectl -n monitoring port-forward svc/grafana 3000
open locahost at 3000 port you will see grafana dashboard. the default username and password is admin.

click on dashboard

open kube-state metrics.

This is cAdvisor

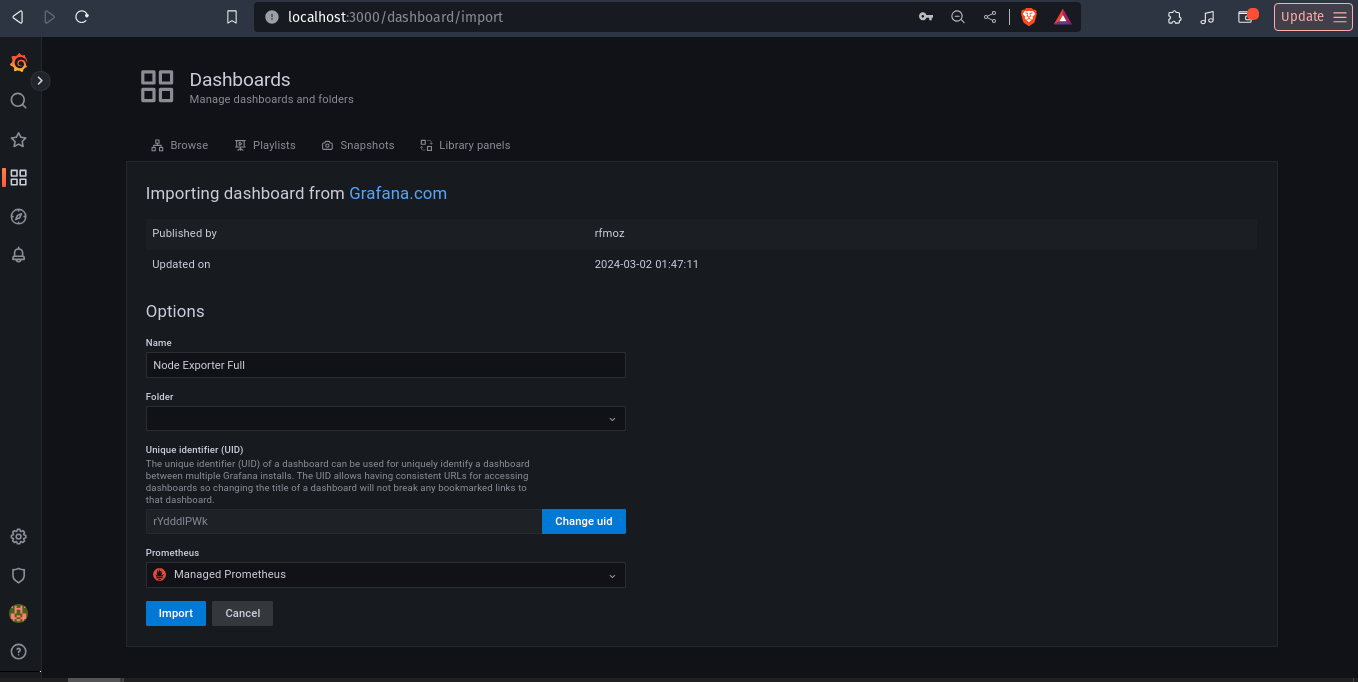
create new dashboard for monitor node exporter component which we have deployed another instance.

import with 1860 code.
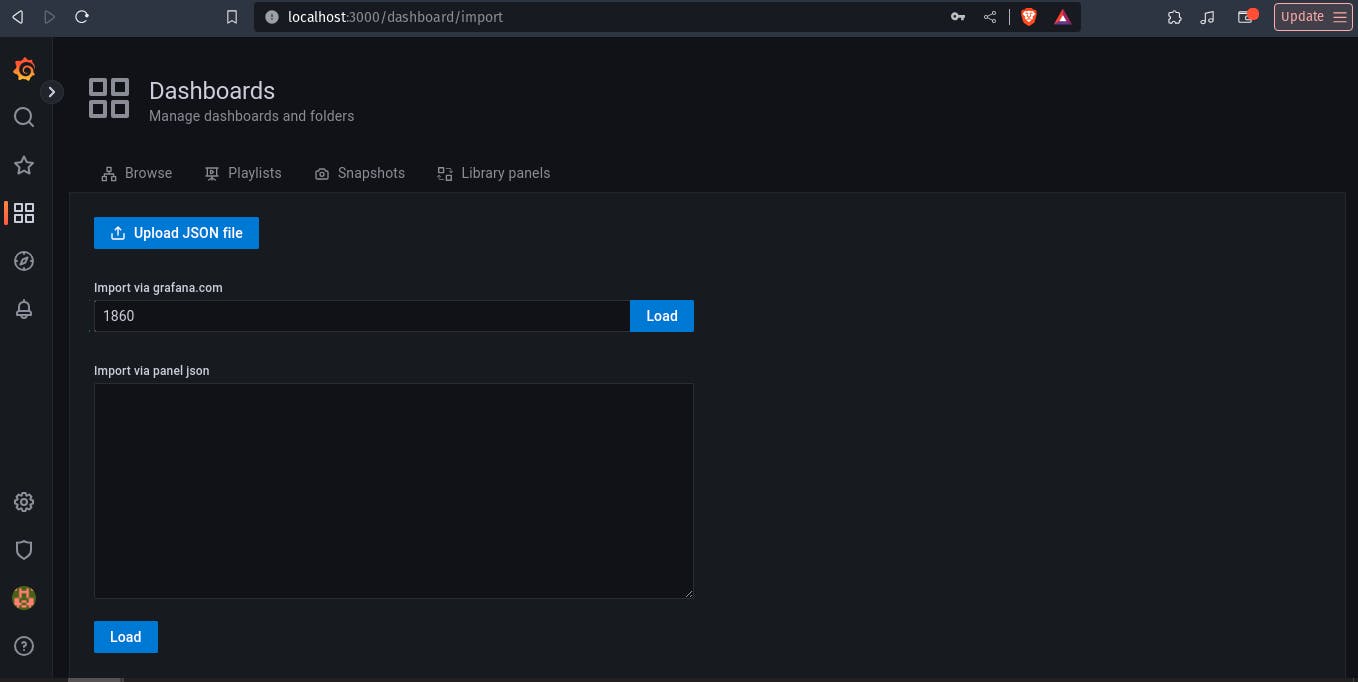
select source as manage prometheus and click on import.
select source as manage prometheus and click on import.
here you see our we can monitor ec2 instances as well with EKS node.

Change instance monitoring with Job.

To destroy whole infrastructure apply terraform destroy
terraform destroy